This is the first of a series of posts that we will be doing discussing the different market rules, behaviours, unwritten laws, etc. Let’s start discussing who are the players in the markets.
Markets could be seen like this:

Lots of small fish, which are the retail traders, and the big fish, which are “institutional”trades, like hedge funds, investment banks, etc. Here at XBP Trading we will call them Small Money and Big Money respectively.
This theory is not mine and you can find endless literature about the subject on the Internet and in trading books. One website that I would like to share with you is No BS Day Trading. Buy the Basic Course, which is just below $90, and learn all about the Big Money tactics. Here we will describe some of those tactics, which are more common and important to us as day traders, and we will see how the XBP indicators can help us to identify these big fish of the markets.
What makes a fish a big fish?
Before we start discussing tactics and indicators, let’s first agree on what makes a trader a Big Money trader. Quite simple: Volume. Retail traders, aka Small Money, trade with lots of 1 contract up to 20 (?) contracts. Those contracts are traded at the same time, could be in more than one order, like you keep adding to a position, but we understand that if the traders is Long in the market he/she will not have a bigger position than those 20 contracts.
Big Money traders will go up to the thousands of contracts. So, imagine that you have your professional trader friend who plays 50 contracts, he is still a Small Money trader. Big ones can move the market by themselves, and that will take few thousand contracts.
Big Money camouflage tactics
Trading thousands of contracts will require different tactics than trading 10 contracts. Most probably, if you could trade 2,000 contracts you will not be able to get fill at one single price level as there would be not enough offer at any single level for that. So, in oder to buy, for example, your 2,000 contracts you have 2 alternatives:
- Buy whatever is available at different price levels, near your ideal entry point. For example if you want to enter at 1910 level, you can buy at 1910, 1909.75, 1909.50 and 1910.25
- Buy at your desired level at different times. The market drops until 1910, you buy 1,000 contracts, then it rallies until 1912.5, drops again (“test the lows”) and then you buy 1,000 contracts again
Obviously, there is a 3rd option, which is a mix of these 2. It seems more realistic that by having a limit of 2,000 contracts and an entry level of 1910, the Big Money trader buys whatever he/she can at 1910, 1909.75 and 1910.25 and does the same thing once the market “tests the lows” again.
Great, so this is the first tactic, which is not much of a tactic but of a need. Still be will call it our Big Money Tactic 1.
In the past, when electronic trading was not the norm, it was “easy” to spot the Big Money entering the market by monitoring the tape. In the tape you can see every single buy/sell order (remember that every single operation in the markets is a buy AND sell operation. Someone buys and someone sells. Deeply think about it and you will realise the complexity of the concept). In the tape you can see Small Money all the time with their small operations of 1, 2, 4, etc. contracts trades. Then, suddenly you saw a big one. A 200, 300, 500 contracts operation. There they are!!! Bingo!
Unfortunately things got more complicated. Obviously, Big Money guys know that you monitor the tape. That you can apply filters or run expensive pieces of software that decompose and recompose the tape. So they play hard to fool you. Different tactics that they use:
- Buy 200 at 1910 to make the market rally, then sell 600 at 1913 (hitting few stops in the middle) to finally close all positions at 1907 (few other stops here again)
- Enter a series of small orders, for example of 7, 5 and 3 contracts, to avoid the filters or the quick eyes of some traders
The first tactic is quite difficult to spot, and it is actually more a strategy than a tactic. In a future post we will dig deeper on this.
The second one is quite commonly used. With the advent of electronic trading, it’s easy to spread a large order into smaller ones and spread them through different price levels and times to disguise the Big Money moves.
How to spot Big Money in the wild
Now that we know the basics of the Big Money traders, let’s see how can we use the XBP indicators to catch them in the act.
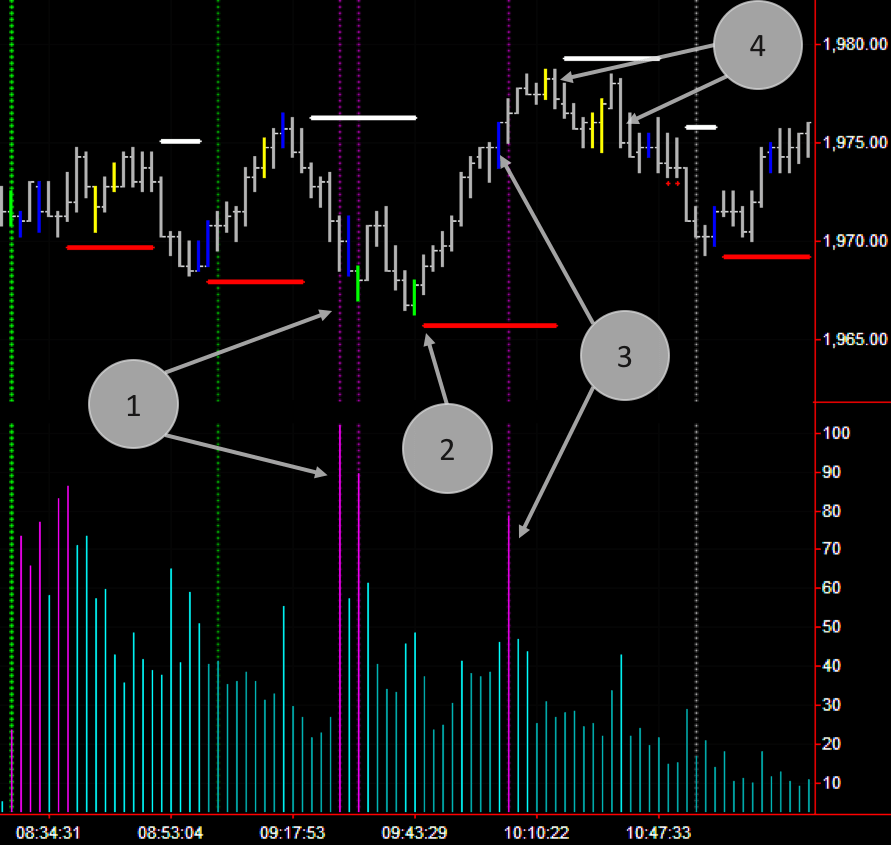
This is a screenshot of a 4,500 ticks chart for the 2nd of March 2016.
The chart has 3 XBP indicators:
- XBP Bulls and Bear Support and Resistance (XBP BB SR) indicator, which plots horizontal lines when the market forces find support (in red) or resistance (in white)
- XBP Tape Players indicator, which paints the bars in blue or green when abnormal high Average-Volume is detected and yellow when the Average-Volume is abnormally low
- XBP Tape Speed, is a histogram indicator plotted at the bottom of the screen that represents the speed at which each bar is completed, or, what is the same, the speed at which the operations occurred in the market
In the bubble (1) we see one blue and one green bar, coupled with two high speed tape bars (purple). Blue bars represent an abnormal high Average-Volume. Blue bars transform into Green bars, when that Average-Volume is the highest on the day. (Note: Average-Volume is just a calculation to average out the number of contracts per each operation inside a bar).
When we see Blue or Green bars it means that an unusual high volume occurred in that bar. This could be a sign of Big Money entering/exiting the market. It could be other cases, which later we see, but always related to Big Money moves.
High tape speed bars in the XBP Tape Speed, are plotted in purple for your convenience. The XBP Tape Speed monitors the speed at which the tape goes. The higher the speed the taller the bar in the indicator. Unusual higher bars are painted purple. Having a purple bar means that orders flew at a higher pace in that bar that in its preceding ones. This could be caused by Big Money traders trying to disguise their large orders by splitting them into smaller ones and blast them through the tape in the hope that they will be filtered out by those tape analysis traders.
As you can see right after bubble (1) the market rallies a bit and comes back to tests the lows to bubble (2).
In bubble (2) we have again a green bar and then a support level, easily visible by the red horizontal bar plotted by the XBP BB SR indicator. This indicator analyses both volume and price and detects when the market is finding support/resistance. Thanks to this indicator you can know that you could enter the market Long to profit from the entry of the Big Money in the market.
In bubble (3) we see a typical “hit those stops” action. The market rallies from the bottom and hits the stops that they were placed by the Small Money behind “the safe wall” of the high of the day (or whatever Fibonacci level, or VWAP, or EMA, etc.) level. You can see an acceleration of the tape and a blue bar of high volume.
In bubble (4) yellow bars appear showing how the Big Money is out of the market now and is letting the Small Money enter the market Long, correctly so, but a bit too early. In a typical move, the market will slowly drop to a more favourable levels, in this example from the 1980 to the 1970 level, at which Big Money will re-enter again the market, this time to take all the way up until the end of the trading day.
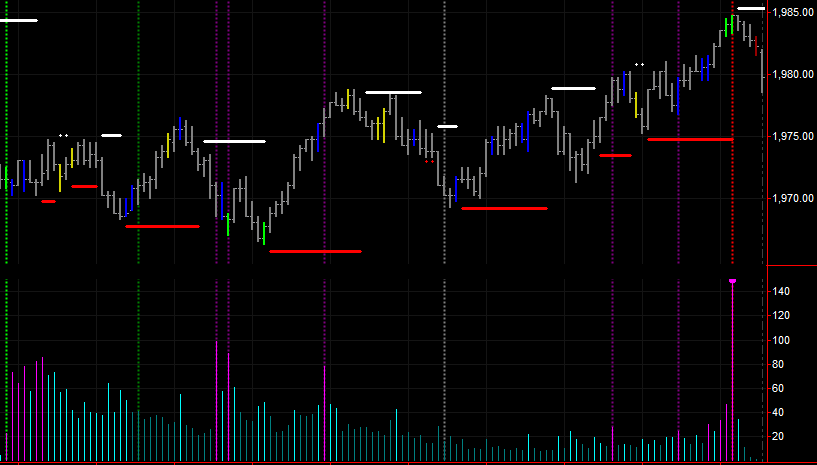
This is the screenshot of the whole day.
Now you know how to spot the Big Money traders. You don’t need to have your eyes glued to the tape and take note of every possible big move you see there. Just add these 3 XBP Indicators to your Trade Station and you will be able to see the market in completely new ways.

1 Comment