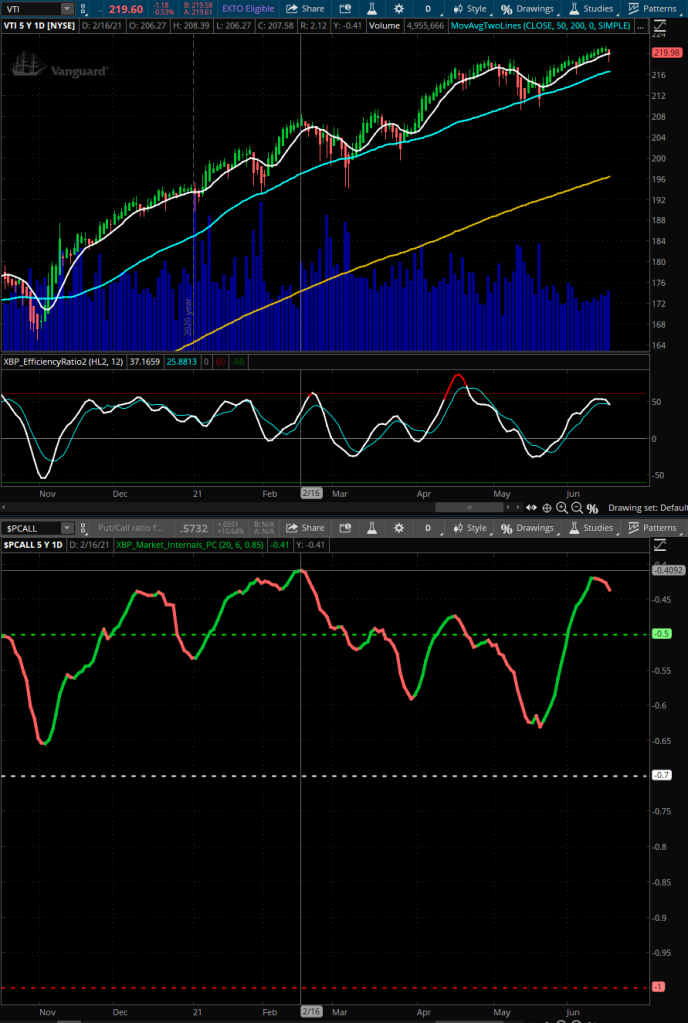
I guess the big question these days is: are we entering a correction period? The signals say yes, specially the Put/Call ratio that has turned red at a very high level and could mark the start of some bear moves.

In this image above we can see that the last time there was a turn in the XBP Market Internals (Put/Call ratio) indicator (mid Feb 2021) that lasted for 13 days in the overall market (here represented by the VTI ETF) and the downward current lasted until the end of March.
The XBP Efficiency Ratio indicator (the one between the price chart and the XBP Market Internals) is also showing a bear reading, not only with an upcoming crossing on the averages but as well with a bearish divergence with price, where price reached higher highs while the indicator only reached lower highs.
These two signals are anticipating a high probability of upcoming bear forces in the broad market.
My second area of concern is the distance that we have between the market and the 200 SMA:

The above chart has the last 5 years of VTI plus the XBP indicators (Efficiency Ratio and Market Internals Put/Call). In the VTI price chart we have three moving averages:
- White line: ALMA moving average as a responsive price average (we could disable the bar chart and just look at this line)
- Blue line: 50 SMA
- Orange line: 200 SMA
Both 50 and 200 SMAs act quite well as support/resistance levels, as they are the most popular averages. If we look at the 200 SMA distance from either ALMA or 50 SMA we can clearly see that they have never been so far away in the last 5 years. Is this the new norm? or will the market correct itself, like in October 2010 where we had a turn in Put/Call ratio together with a bearish divergence in the Efficiency Ratio?
Caution ahead is what the indicators are clearly telling us. So hold any new investments. Wait until the indicators return to more advantageous levels and if you have some positions that you could collect some profit, I would say that it is a good moment.
Getting the XBP Indicators
If you are interested in using the XBP indicators, simply send me an email and we will complete the transaction using PayPal. The price of all indicators for a life-time license is of USD 100 or just 2 E-mini points.
PayPal link: paypal.me/xbptrading
Why there is no a “Buy” button in the site? Well, because I’m not a company. My business is not to sell you indicators but to improve my trading every day. The revenue that I get from these indicators go to fund my online video-game library 🙂
Jordi have you a version of your put/call ratio code in easylanguage?
LikeLike
Unfortunately no, but it should not take you much effort to translate it to Easy Language.
LikeLike