For the last two weeks the market has advanced, for example if we look at VTI on the 18th of May it was around the 214 mark, but two weeks later we are at the 218 mark, just 4 points higher. Meanwhile the XMP Market Internals Put/Call Ratio indicator went from -0.62 to -0.47. Let’s multiply that for -100 and we can say that went from 62 to 47 points. Quite a raise! We can compare it with the latest bull period, during the month of April where VTI went from 205 to 217, while XBP Ratio went from 58 to 47.
In summary, in April, VTI advanced 12 points while XBP Ratio advanced 11 points, and in May/June, VTI has advanced 4 points while XBP Ratio added 15 points. There is something strange here.

Let’s broaden our analysis and look back at the market in a longer time frame. Above is the VTI since June 2019. As always, in the price chart we have the ALMA moving average (white line), the 50 SMA (blue line) and the 200 SMA (yellow line). The first lower indicator is the XBP Efficiency Ratio and below it is the XBP Market Internals Put/Call Ratio.

The screenshot above is the same as the previous screenshot but starting in June 2017.
Comparing these 3 screenshots, we can see the following:
- Since the COVID-19 crash recovery the XBP Market Internals Put/Call Ratio indicator is above the mi-level of -0.7 while before the crash it was very difficult for the indicator to sustain itself above -0.7 for long
- Any major market reversal in a bull market (price above 50 SMA) occurred when both XBP indicators synched in signaling a reversal. XBP Efficiency Ratio peaked in overbought territory (red zone) (or shown a bullish divergence with price action) and the XBP Market Internals Ratio indicator printed a reversal above mid-level -0.7
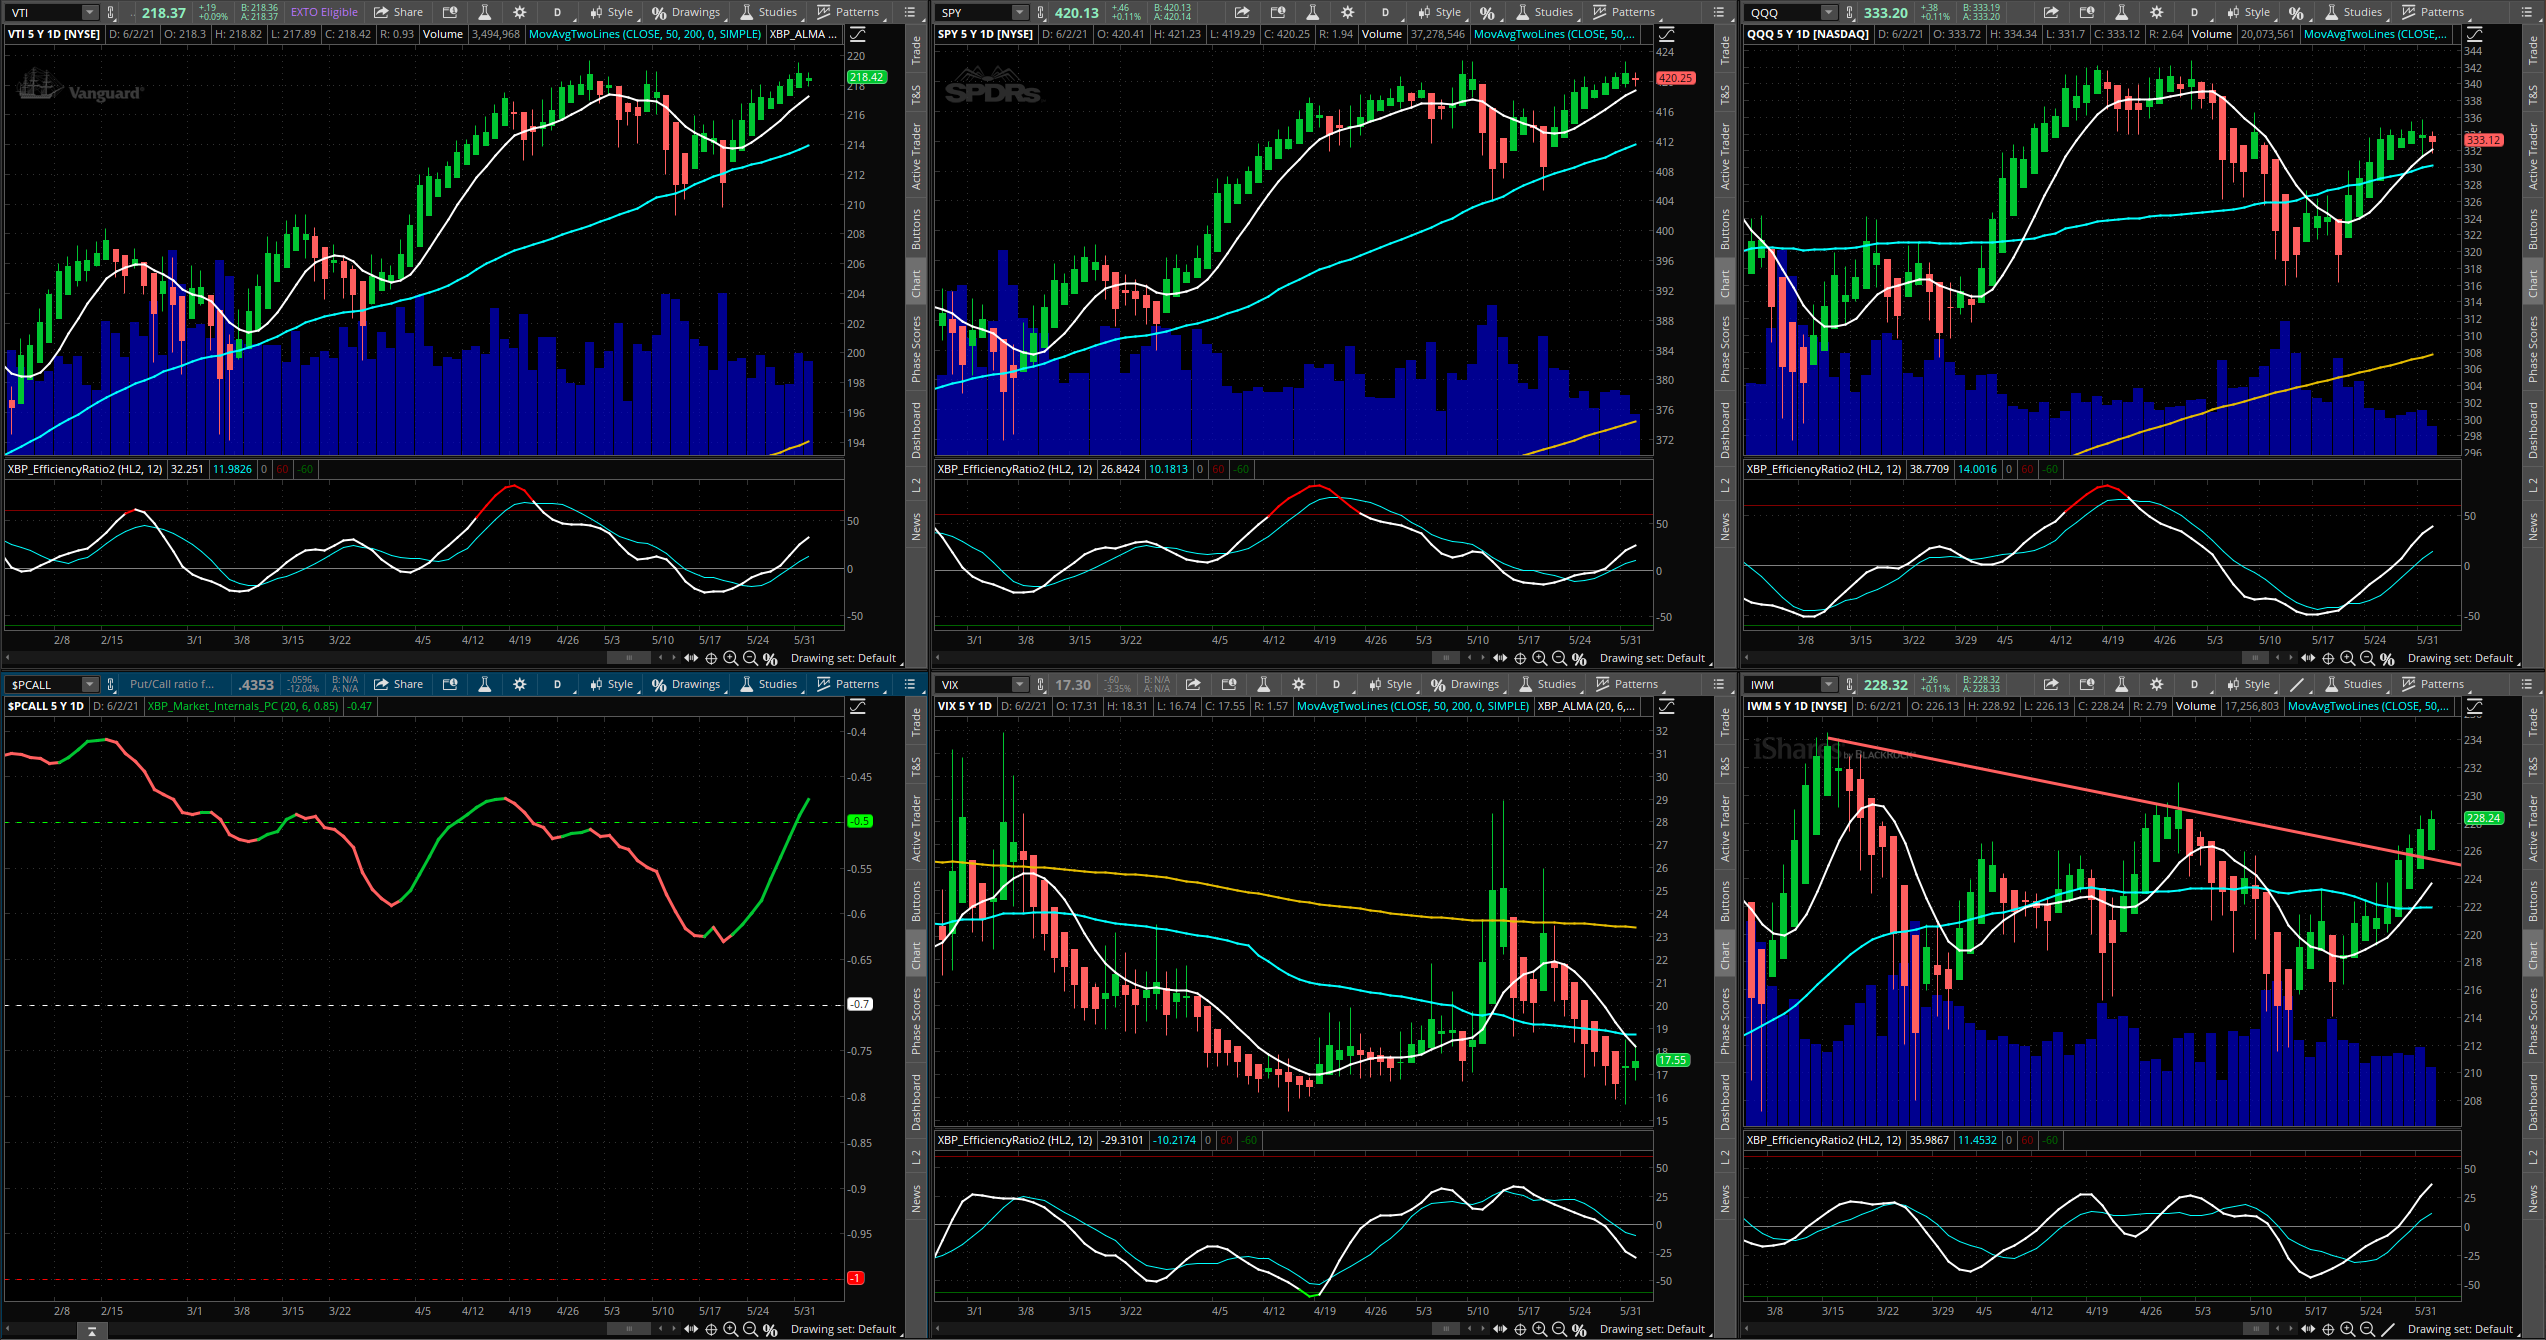
Checking the very first screenshot, we can see that the Nasdaq (QQQ) has underperformed while the Russel (IWM) as broken above the trend resistance level. This could explain the somewhat lukewarm status of the overall market (VTI).
Another area of concern, this time less based on indicators but more in feelings. We have never been this far from the 200 SMA level. Checking the last 5 years of data, we touch the 200 SMA more or less every year. Last time we touched it was June 2020, one year ago. But at that time we crossed above it as we were coming from the lows of the COVID-19 crash. Yet, it feels strange that we do not go to revisit those levels again.
The outlook for next week is of holding positions but be very alert of market moves. Keep an eye on the XBP Efficiency Ratio and be ready to exit at any moment.
Getting the XBP Indicators
If you are interested in using the XBP indicators, simply send me an email and we will complete the transaction using PayPal. The price of all indicators for a life-time license is of USD 100 or just 2 E-mini points.
PayPal link: paypal.me/xbptrading
Why there is no a “Buy” button in the site? Well, because I’m not a company. My business is not to sell you indicators but to improve my trading every day. The revenue that I get from these indicators go to fund my online video-game library 🙂
