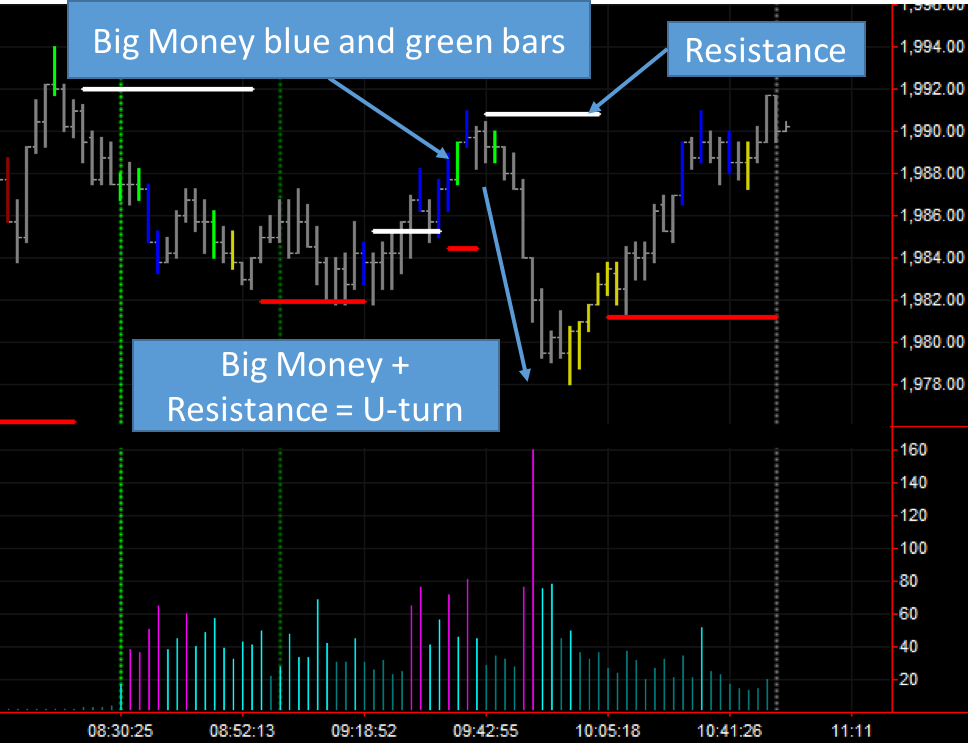
Screenshot of the market action (before close) for the 9th of March 2016 on a 4,500 ticks chart.
Today we had the same setup that happened on the 7th of March. The Big Money traders enter the market, a resistance appears and the market plummets. This time 12 points in just 8 minutes!
You could have made easily from 8 points of profit if you had entered short at 1988 and exited at 1980 when those yellow bars appeared. Yellow bars are an indication of very low volume and assocaited to Small Money traders (retail) heading on the wrong direction.
For more on the meaning of the blue and yellow bars you can check this and this post.
