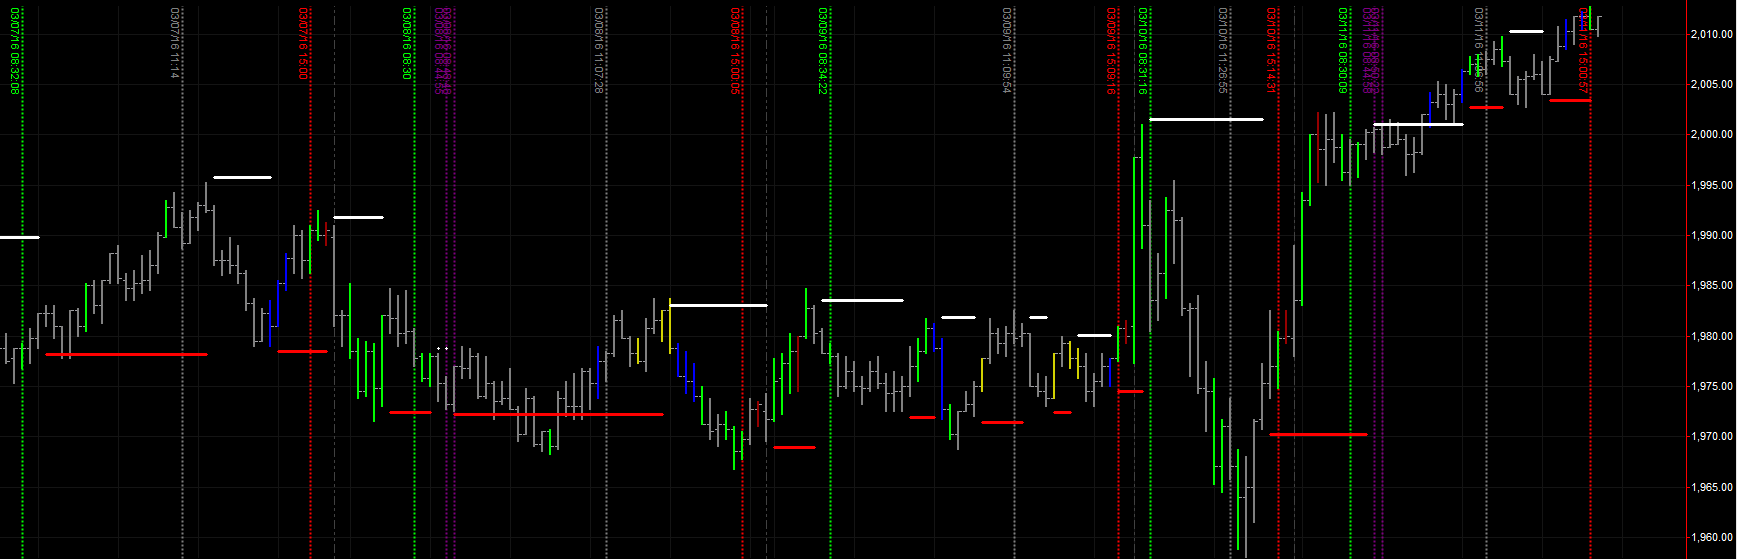
To review the action of the whole week we use a 13,500 ticks chart and reduce the indicators to only XBP Bulls and Bears Support and Resistance (XBP BB SR) , XBP Tape Players and XBP Key Market Times. We recommend to keep this screen always open during your day trading to give you context of the action over the span of the last 15 trading days.
This week we will split the analysis in two different parts. In the first part we will identify the key levels based on the XBP Bulls and Bears Support and Resistance (XBP BB SR) levels, looking at those price levels where we had the most supports and resistance levels printed. In the second part we will do the same using the XBP Tape Players indicator instead, looking at those levels where we had the highest volume entries (green bars).
Part 1: Week analysis based on XBP BB SR indicator:
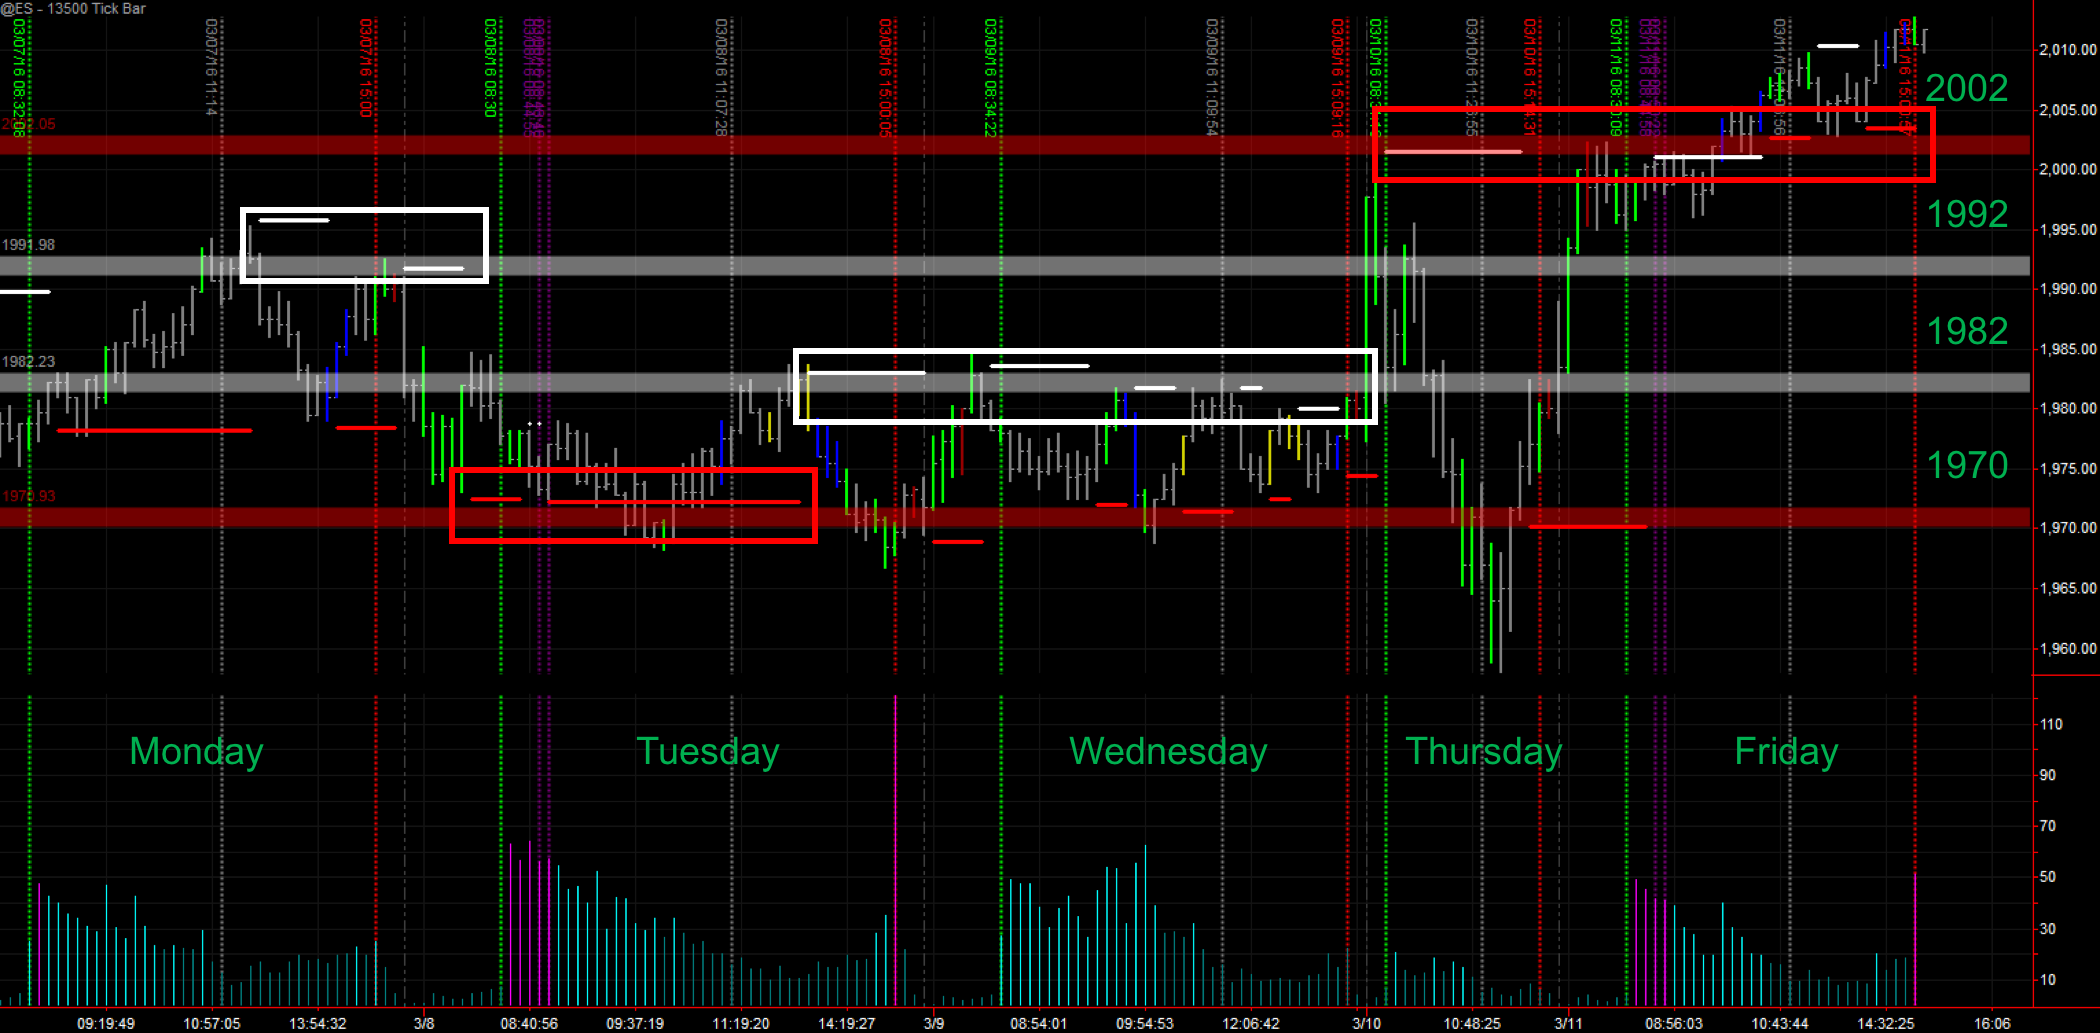
Key levels: 1970, 1982, 1992 and 2002
For each level you have a white or red box identifying the first time that the level was identified as a key level.
Part 2: Week analysis based on XBP Tape Players indicator:
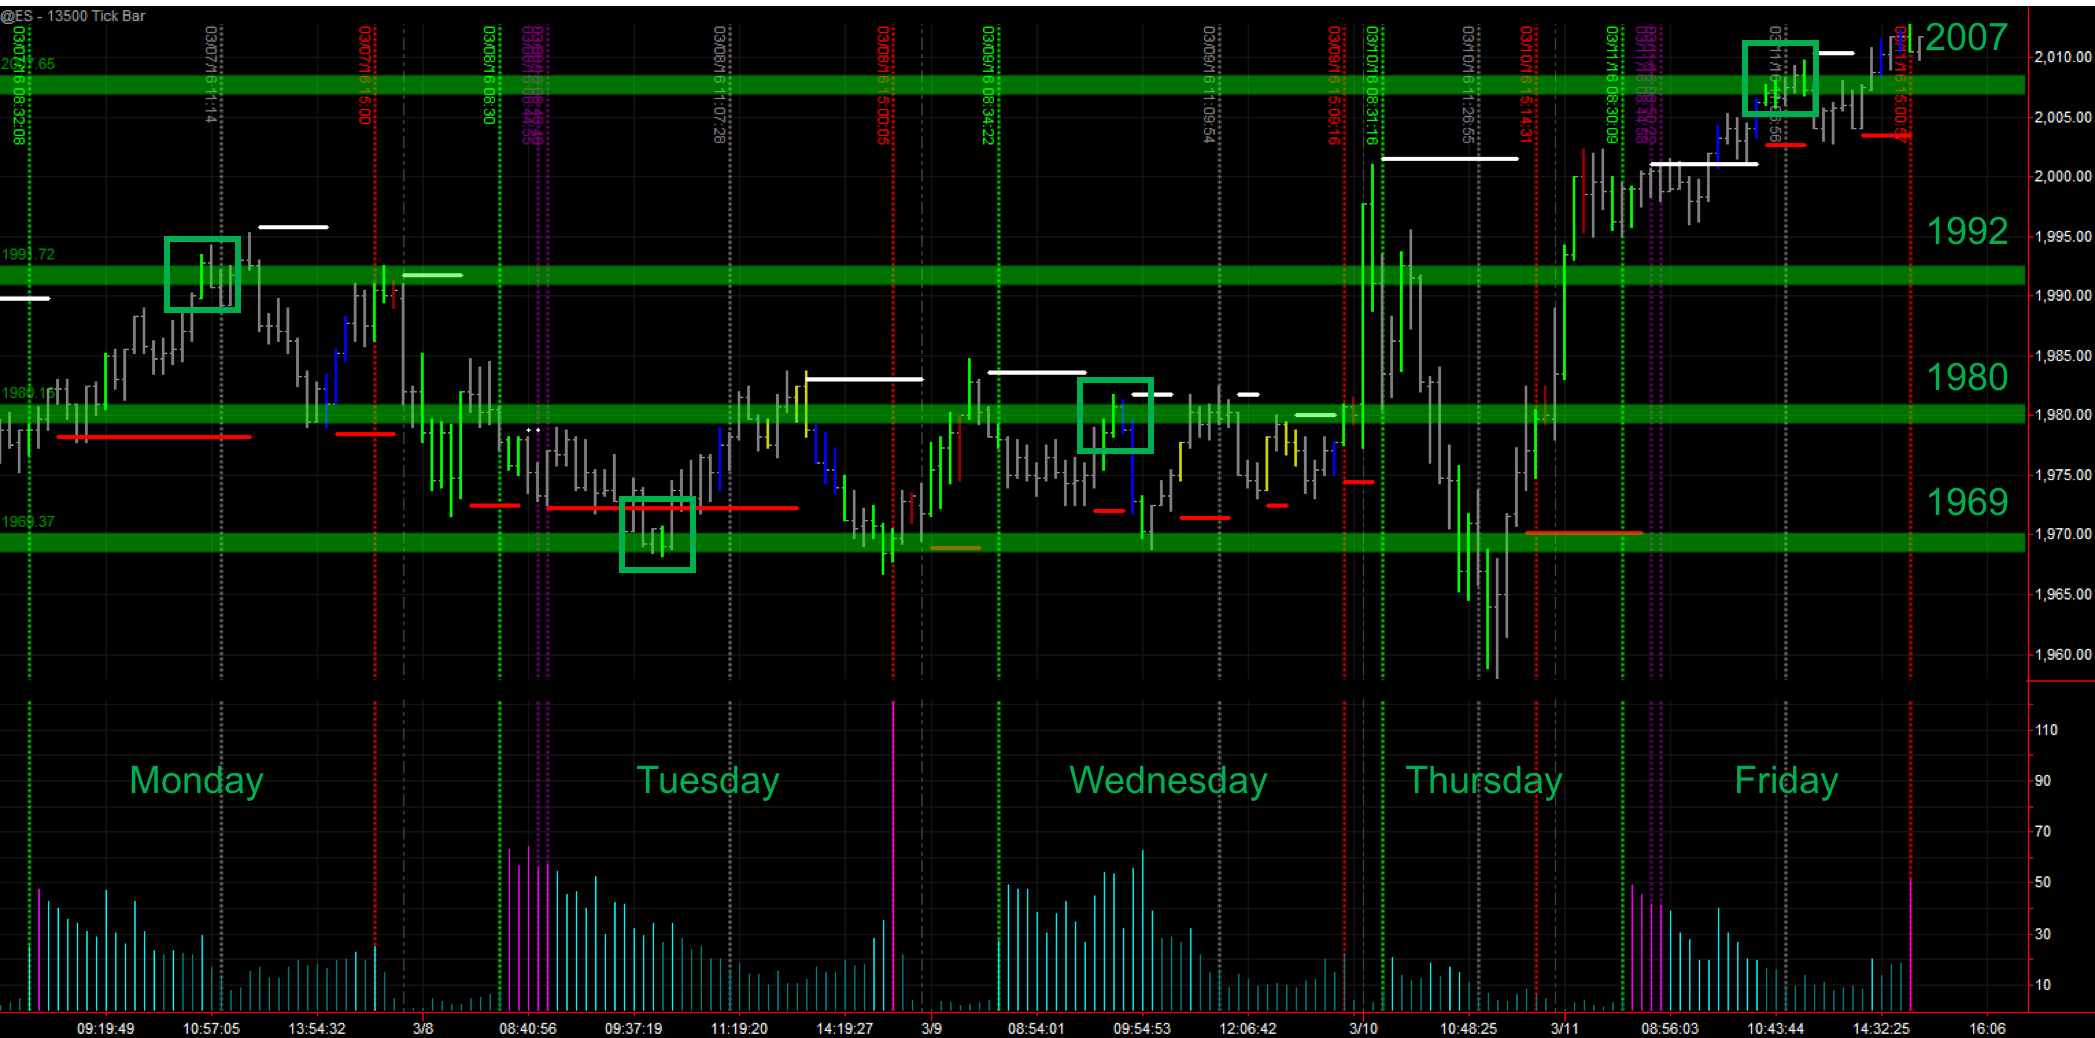
Key levels: 1969, 1980, 1992 and 2007
For each level you have a green box identifying the first time that the level was identified as a key level.
If we join now all the levels we get the following key areas to monitor for next week’s trading:
- 1969-1970
- 1980-1982
- 1992
- 2002-2007*
Area 4 is a too new a too wide. We will have a closer look at it during next week if price action occurs around these levels.
