The XBP Bulls and Bears Support and Resistance Levels indicators (XBP BB SR) are two indicators that measure the Bulls and Bears forces in the market by analyzing price and volume. The lower indicator plots the two forces, while the upper indicator plots support and resistance levels.

TradeStation provides volume for both upticks and downticks. Combining a price action analysis and the upticks and downticks relationship, the XBP BB SR indicators infer the activity of the two forces existing in the market, Bulls and Bears.
The lower indicator plots those two forces. Clear trading opportunities occur when the distance between these forces is higher. If the two forces are on balance, there will be multiple false signals and we shall avoid trading during those times.
Periods of balance and unbalance occur daily and are the norm in the market. This lower indicator helps you to identify these periods.

The upper indicator plots support and resistance levels whenever the two forces cross each other, marking that one force is dominant above the other. The indicator plots a support (by default in red) if the Bulls are the dominant force and a resistance (by default in white) when the Bears are in control.
Additional volume analysis logic has been added to the upper indicator to ignore periods where the two forces are in balance. There will be moments where you will see a cross in the lower indicator that doesn’t get plotted in the upper indicator. This is completely normal and is not a malfunction.
The indicator works well with multiple time frames. Higher time frames signals will be less frequent but stronger. Once a new support or resistance level is plotted in the higher time frame, wait for the same level to be plotted in the lower time frame to enter a position.
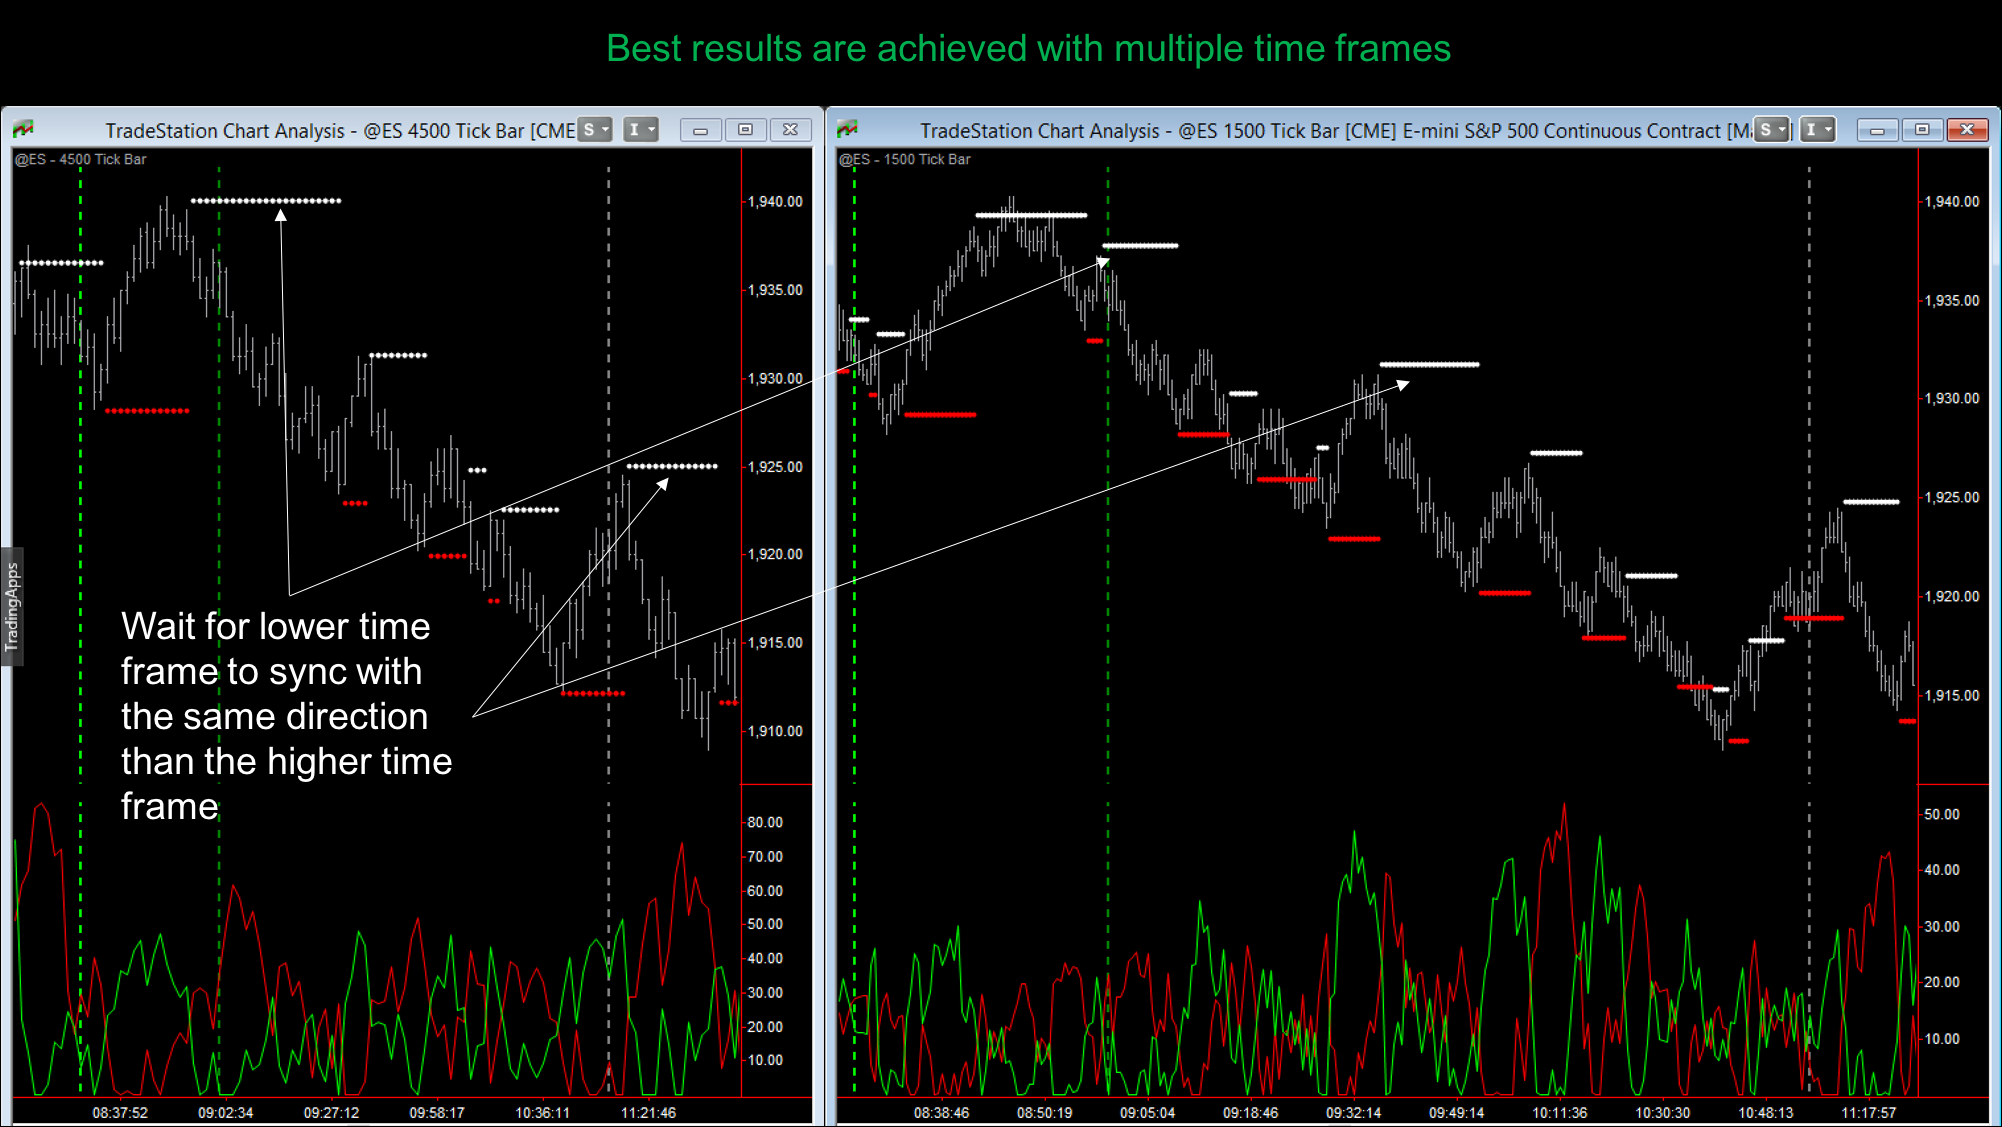
For example, in the attached screenshot the higher time frame is 4500 ticks and the lower time frame is 1500 ticks. When in 4500 ticks a new resistance level (white) is plotted wait for the next resistance level to be plotted in 1500 ticks to enter a short position. Exit the position once the next support level (red) is plotted in 1500 ticks.
You can subscribe this indicator to your TradeStation by clicking the button below:

