Complex things can be better understood if you split them in smaller parts and understand them separately before you can understand the whole. Let’s do the same with our screens and indicators:
The screens:
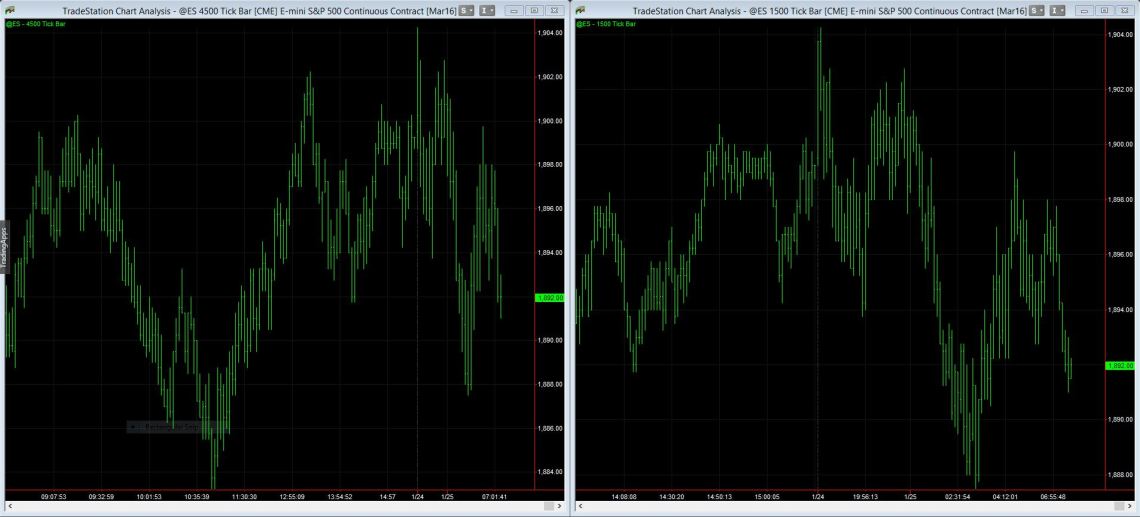
We use two time frames, 4,500 and 1,500 ticks, each one in its own window and side to side:
A tick occurs when a seller and a buyer reach the agreement to close a trade. The seller sells X amount of contracts to the buyer and the buyer buys them. This single trade is 1 tick and the X amount of contracts is the volume for that single tick.
A 1,500 ticks chart will close a bar once 1,500 trades have happened. Remember, for a trade to happen a seller must sell at least 1 contract to a buyer. Then the minimum volume of a 1,500 ticks bar will be 1,500 contracts, but often is higher than that as trades normally have a higher volume than 1.
We use two time frames to help us recognise big trend or cyclical moves in the highest time frame, in our case 4,500, and choose a good entry and exit point using the lower time frame, 1,500.
There are traders that use more time frames, normally 3, and that will be helpful for some and will add too much noise to others. Try it yourself, you can add a lower time frame with a 500 ticks chart or a higher time frame with a 13,500 ticks chart. The ratio is that each time frame is 3 times its lowest
The Main Indicator:
The main indicator that we use is the XBP Bulls and Bears Support and Resistance Levels, XBP BB SR for short.
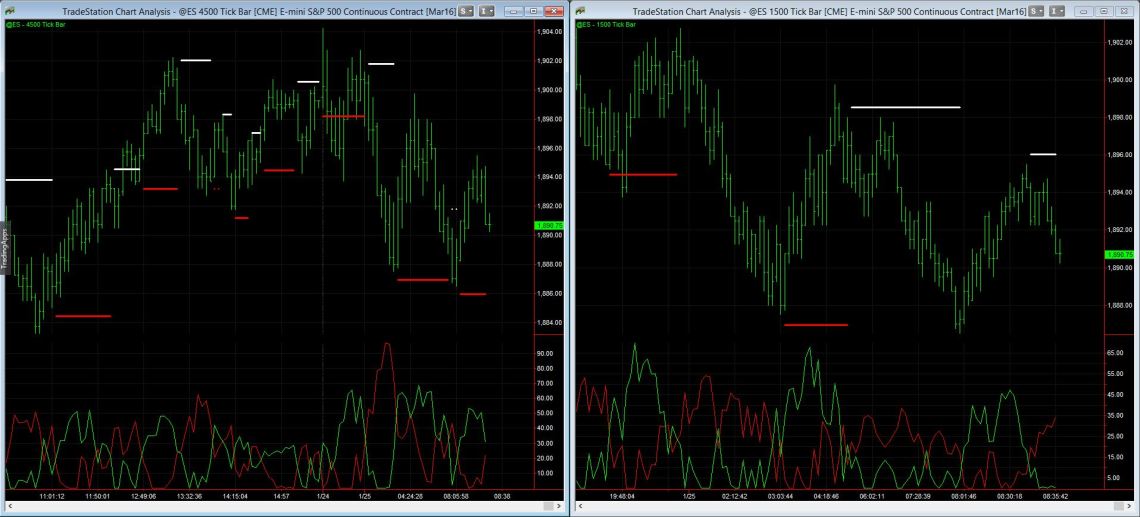
We have put a lot of effort on this indicator to make it as simple as possible. You can just have the charts configured with this indicator and trade based on the signals of one of the time frames. The methodology would be to use the support and resistance levels to enter in the opposite direction and profit from a bounce in price. For example, if a new support level, by default in red colour, is printed, then enter a long position. Exit the position once either your profit target is reached (I use 2 points and a quarter) or a resistance level, by default in white, is reached.
If you would like to have more risk but potentially bigger profits per trade, follow the 4,500 ticks chart. If you would like to reduce risk but have potentially smaller profits per trade then follow the 1,500 ticks chart.
The 4,500 ticks chart gives less signals but bigger moves. Inside one move you could have big swings, and it will require a bigger stop loss from your side (at least 8 points), which implies a potentially bigger loss.
The 1,500 ticks chart gives more signals by revealing smaller moves. These moves could be inside a bigger move visible in 4,500 ticks (this are my favourites!). By following the 1,500 ticks chart you will require a smaller stop loss (I like to use 3 or 4 points) but you will find yourself exiting the move sooner than in the 4,500 ticks.
If you are starting with tick charts, play it safe and use only one time frame. Use 1,500 ticks and go with it until you get familiar with all the indicators.
The Secondary Indicators:
The rest of the XBP indicators are optional and we have develop them to help us understand better what is brewing in the market. You could well play without them and still do well, but some traders like to have a broader vision of market internals.
In the Indicators section you will find the explanation of each indicator and I will not repeat it here. Instead, I would suggest that at least you configure two of the indicators, the XBP Market Key Times and XBP VWAP:
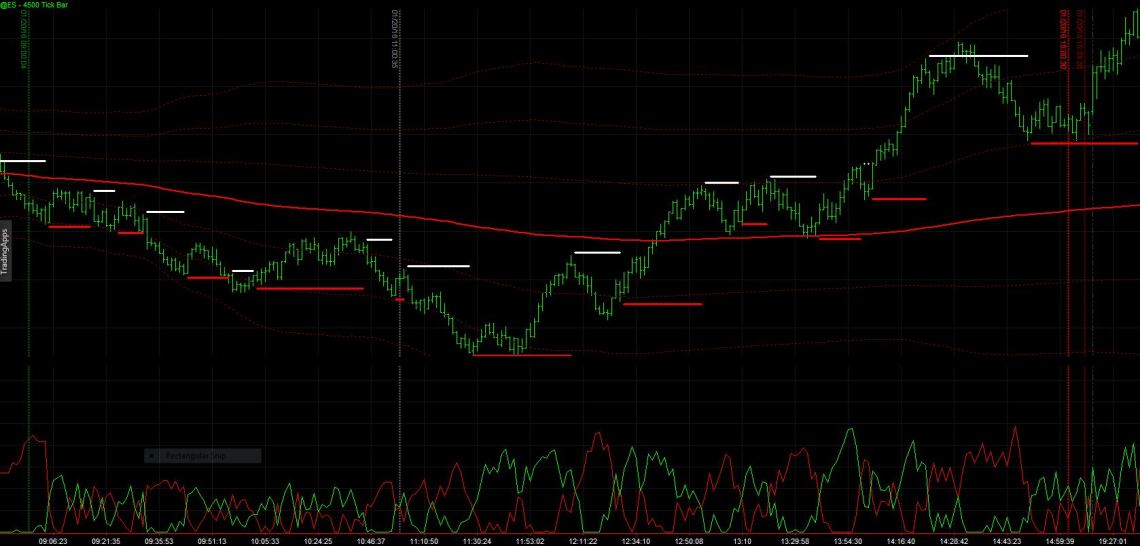
XBP Market Key Times draws vertical lines at the following key times:
- Market’s Open: 08:30
- First Market Hour: 09:30
- Midday: 11:00
- 15 minutes before the close: 15:00
- Market’s Close: 15:15
This help us to better understand our charts by identifying the open and close of the day and the key first trading hour.
XBP VWAP calculates and displays the Volume Weighted Average Price and the 1st, 2nd and 3rd standard deviations for both up and down side. You will find how these levels act as Support and Resistance levels many days, specially the main VWAP level, as it is a widely spread used level.
Knowing that VWAP is a very popular level also give us an edge. We can assume that many stop losses will be place behind the VWAP level hopping that it will hold in an eventual drop/rise of the market. Professional market players know this too and will play to catch those stops. Let’s ride the wave with them to profit from quick price action!

1 Comment