Review of market action for the week of 29th of February to the 4th of March 2016:
To review the action of the whole week we use a 13,500 ticks chart and reduce the indicators to only XBP Bulls and Bears Support and Resistance (XBP BB SR) , XBP Tape Players, XBP Tape Speed and XBP Key Market Times. We recommend to keep this screen always open during your day trading to give you context of the action over the span of the last 15 trading days.
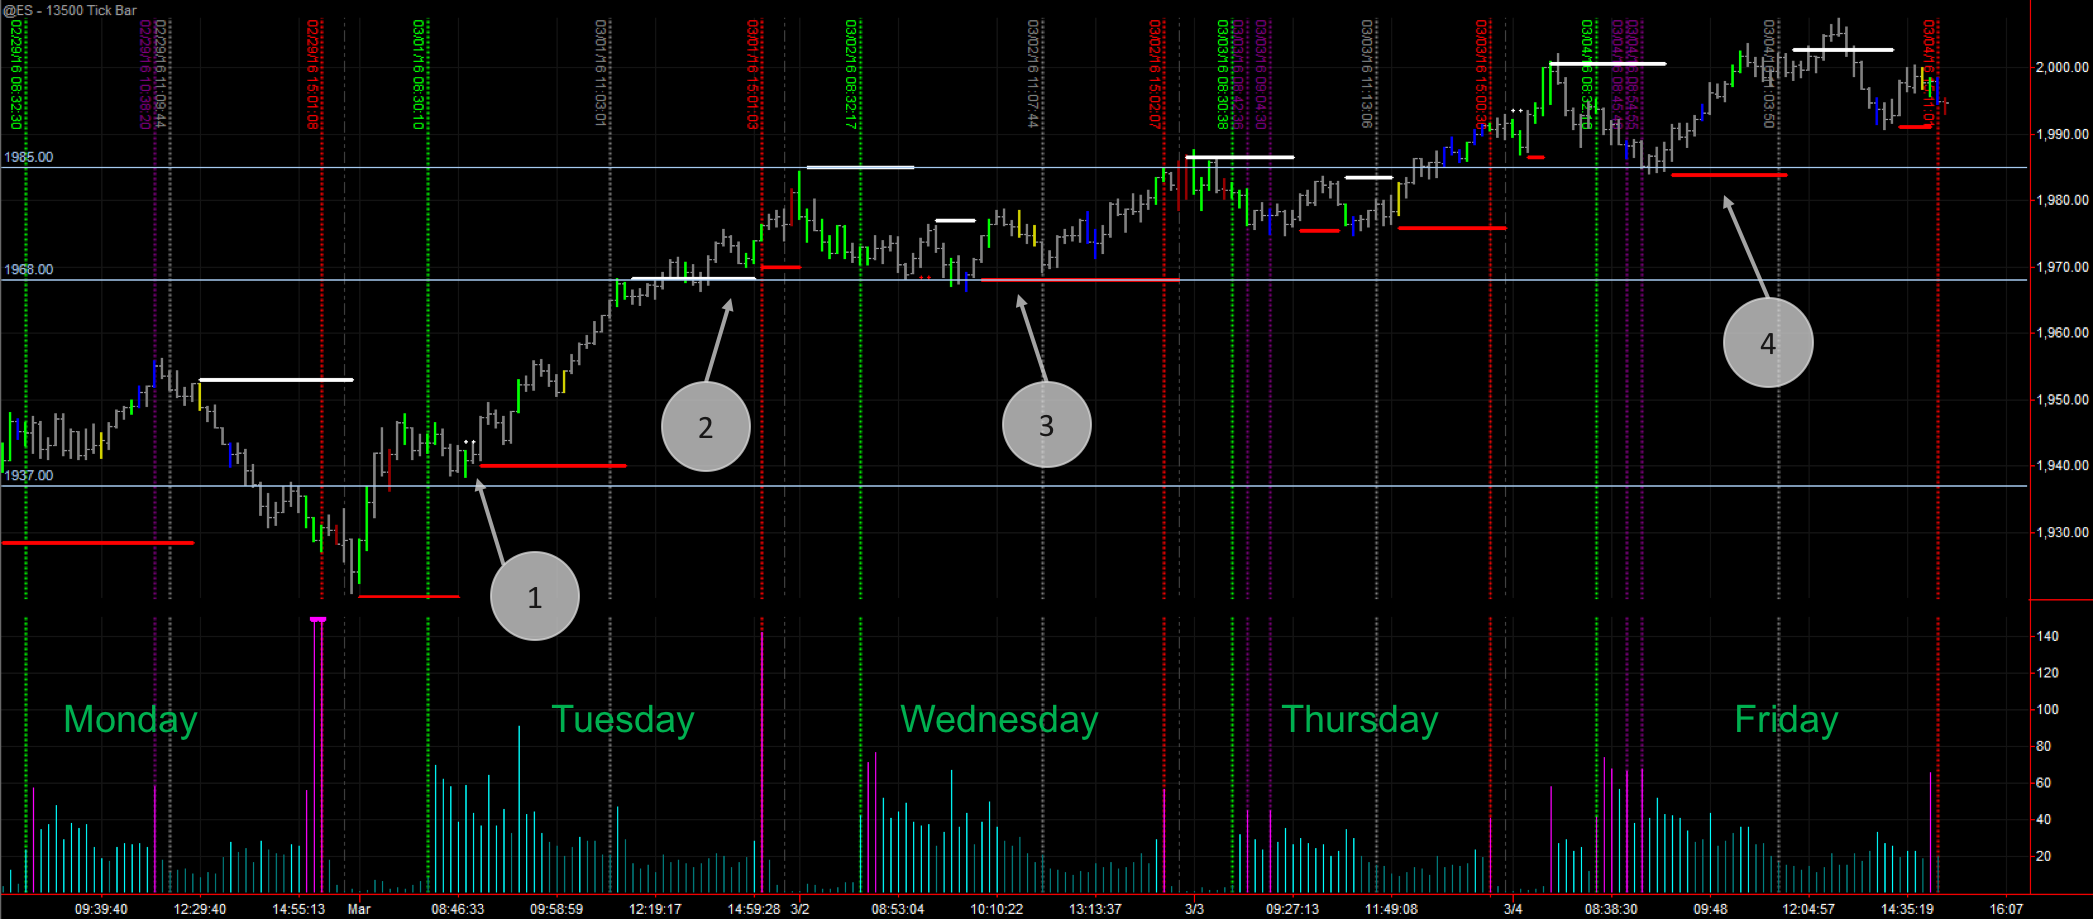
Key levels identified:
Bubble (1): 1937 (1940) This level comes from last weeks action. On Tuesday the market finally transformed this previous resistance level into a support level. We seen a horizontal red line by XBP BB SR indicator and a significant green bar by XBP Tape Players indicator. As seen this was the moment that the market took off to higher levels.
Bubble (2) and (3): 1968 (1970) The second key level of the week, first a resistance and later a support. Plenty of volume at this level as per the green bars and strong support level.
Bubble (4) 1985. The last level of the week to flip from resistance to support. It took 2 attempts to break it and finally when it was broken on Thursday it came along a lot of volume, visible by the group of blue and green bars. On Friday the market found support when testing the level.
You can also see a resistance at 2,000 level. This is a “too round” level to not offer some kind of psychological resistance. The level has only been tested once during trading hours, on Friday. We will see how the trading goes, but plenty of volume has to show up to stop the Bulls at this time. For now I keep my bullish view on the market for next week.
