The XBP Tape Speed indicator shows the speed at which each bar in a ticks based graph has been completed. This can give us an idea of the tape speed, as the higher the tape speed the faster a tick candle will close.
In time based graphs, like 1 minute, each bar takes exactly the exact amount of time to be completed, defined by the graph’s setup; but in tick based graphs, for example in 1500 ticks graph, the time that takes to complete a bar differs for each bar. The Bar Speed indicator shows you a speed value on a histogram graph for each bar.

1500 ticks graph for mini ES futures on 10th of July 2015
High speed bars denote extreme buyers/sellers activity and could signal a support/resistance area and a possible turning point.
Traditionally big market players were entering the market with high volume orders, making them visible when studying volume indicators; but on today’s market the big players try to hide behind a bunch of small volume orders. The bar speed indicator in a tick bar chart makes it easy to spot activity spikes regardless of their volume.
The XBP Tape Speed indicator helps us to read the market action in different ways. Let’s use the following mini ES futures chart as an example:
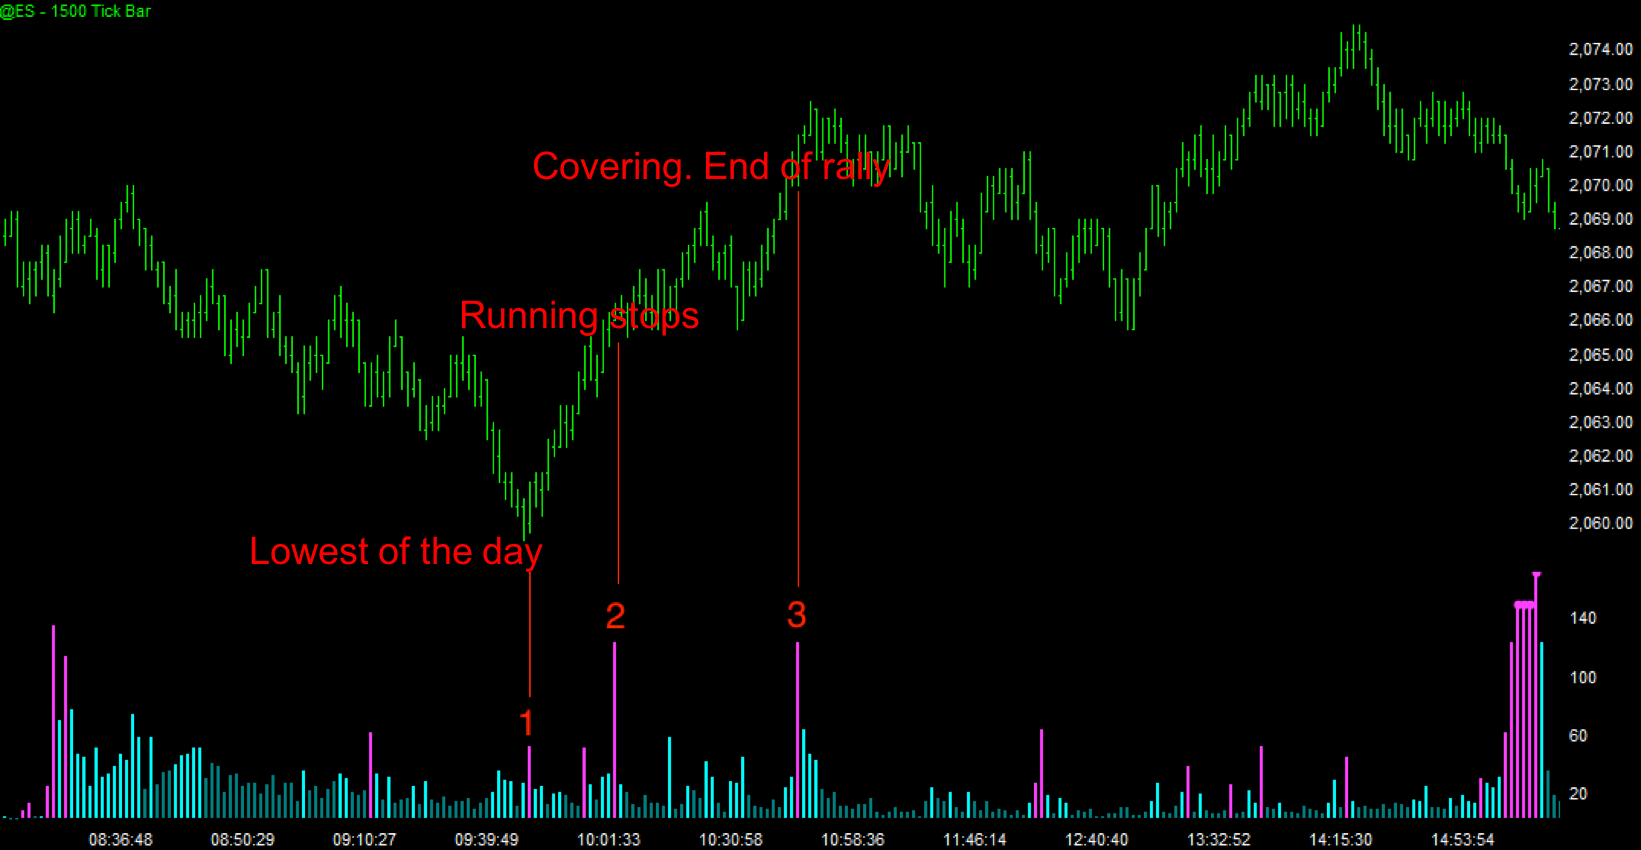
The XBP Tape Speed indicator has 3 colors to help us easily identify the different speed bars. Dark cyan bars are normal speed bars that can be ignored, market is working at an average speed. Light cyan bars are relatively high speed bars but not by much. Purple speed bars are relatively extreme high speeds bars and are worth our attention.
The bar marked as number 1 helps us to spot a high speed bar that will become the lowest low of the day. Bar marked as number 2 corresponds to all the stops that are being executed. Those stops belong to the traders with short positions betting on a lower market. Finally, bar marked as number 3 identifies the end of the bull rally.
Due to the nature of the markets, sometimes we can have speed bars that are more than 1,000 times higher than the average. These bars corrupt the indicator visualization and don’t add any value with such high levels. To prevent this behavior this indicator will automatically cap any speed bar higher than 5 times the average. This is what is called the Over-Speed Level. Capped bars are marked with a small dot at the very top.
Opening and closing times are high market action moments that will naturally signal many extreme high speed bars. Just ignore those readings.
You can subscribe this indicator to your TradeStation by clicking the button below:


3 Comments