They cannot hide from the tape. Maybe they can split their orders, they can confuse you with their icebergs and other figures, but when they are prompted for action… they reveal themselves.
Let’s have a look at today’s chart. Just one single chart will be enough:
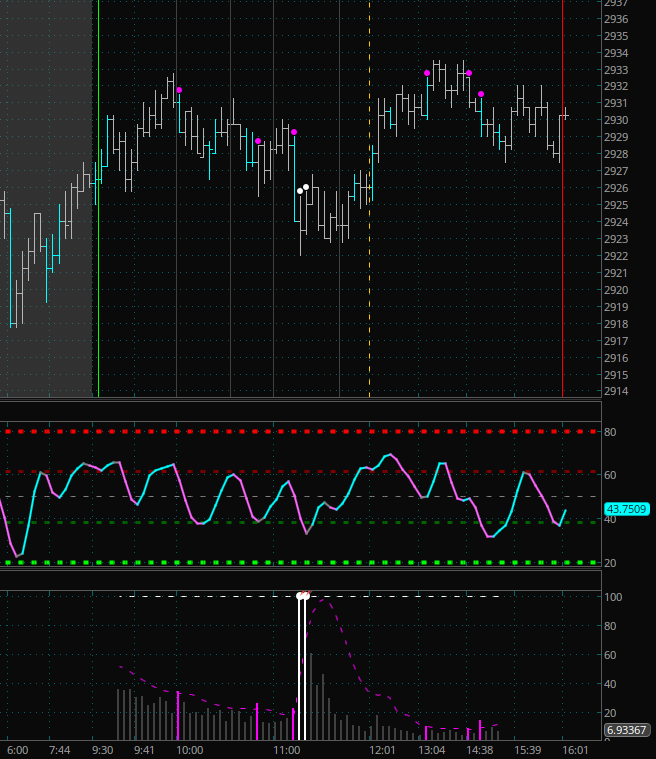
Do you see anything unusual? Perhaps few minutes after 11am… (NYSE time)
The indicator at the bottom is the XBP Tape Speed indicator. This indicator measures the speed at which each bar (in a tick bar chart) is closed. The faster the bar is closed, the higher the indicator value will be. This is what I call “tape speed”.
In a tick bar chart, each bar closes when a certain number of ticks (or market orders filled) have been done. For example 4181 in the screenshot here (this number is part of the Fibonacci sequence). Then we can calculate the actual time that took each bar to close and plot this time in an indicator.
As I’ve been using this indicator for quite a long time, I’ve observed that small fluctuations in speed are normal and irrelevant. On the other hand, sudden and strong accelerations of the speed have a deep impact in the market. This impact sometimes can be felt through many days as the price level where these sudden accelerations happen could act as a support/resistance level for many days.
The differences in speed are sometimes so big that I had to tweak the indicator and cap the maximum plotted speed to a certain level to avoid scale problems when plotting the indicator. In today’s case, the indicator is capped at level 100 and the extreme readings that occurred soon after 11am were capped at that level as shown by the change to the color white and the dots at the top.
As no indicator shall be analyzed in isolation, you can see the XBP Volume Ratio indicator above the Tape Speed indicator as well.

At (1) we have a clear divergence, when the indicator shows a new higher low but price is testing the previous lows. At that moment we can wait for price confirmation and then enter bullish the market with confidence. We have an extreme tape speed reading plus a volume ratio bullish divergence.
We shall stay in trade until we either reach our profit target or see a contrary reading on any of the indicators. At (2) we see that once price reached the previous intraday high, the Volume Ratio indicator is giving us a bearish divergence. Then it will be time to close our position for the day.
This setup today could have given an easy profit of 5 points but little risk and strong evidence of market forces. All thanks to “reading” the tape.
Getting the XBP Indicators
If you are interested in using the XBP indicators, simply send me an email and we will complete the transaction using PayPal. The price of all indicators for a life-time license is of USD 100, just 2 E-mini points 😉
PayPal link: paypal.me/xbptrading
Why there is no a “Buy” button in the site? Well, because I’m not a company. I’m just a trader. My business is not to sell you an indicator. Still, I’m exploring ways in which I could automate this process.
