We had a fast day of trading on the 11th of December 2018, with difficult turns back and forth during the first hour of trading. On these days is good to seat back and try to see the big picture. The analysis of tape speed can give us good clues of where the most extreme action is happening.
Tape speed is graphically measurable in a tick chart due to the dynamic time nature of these type of chart where each bar takes different time to be completed. Remember, that a bar is closed after X ticks, or trades, have been completed. In the attached chart the tick chart (the one on the left) is configured to 4181 ticks, meaning that a bar will be closed after 4181 trades have occurred. The time that will take to complete these amount of trades will change from bar to bar and we can plot that time and analyze it.
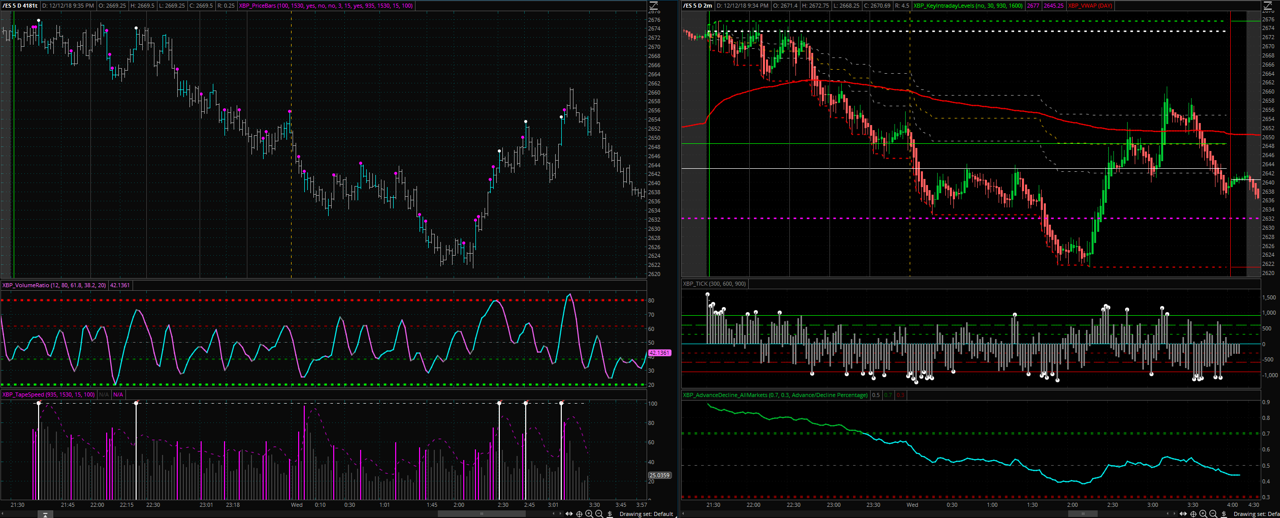
On the chart on the left, the very bottom chart represents the speed of each bar. The highest the bar, the fastest the bar was completed. The purple lines represented faster than average bars while the white bars are extremely fast bars that are capped to prevent having a distorted scale in the graph (some bars can be really fast).
If we pay close attention to the first our of trading, we have 2 white speed bars occurring at around the same level, which also occurs to be the Opening level:
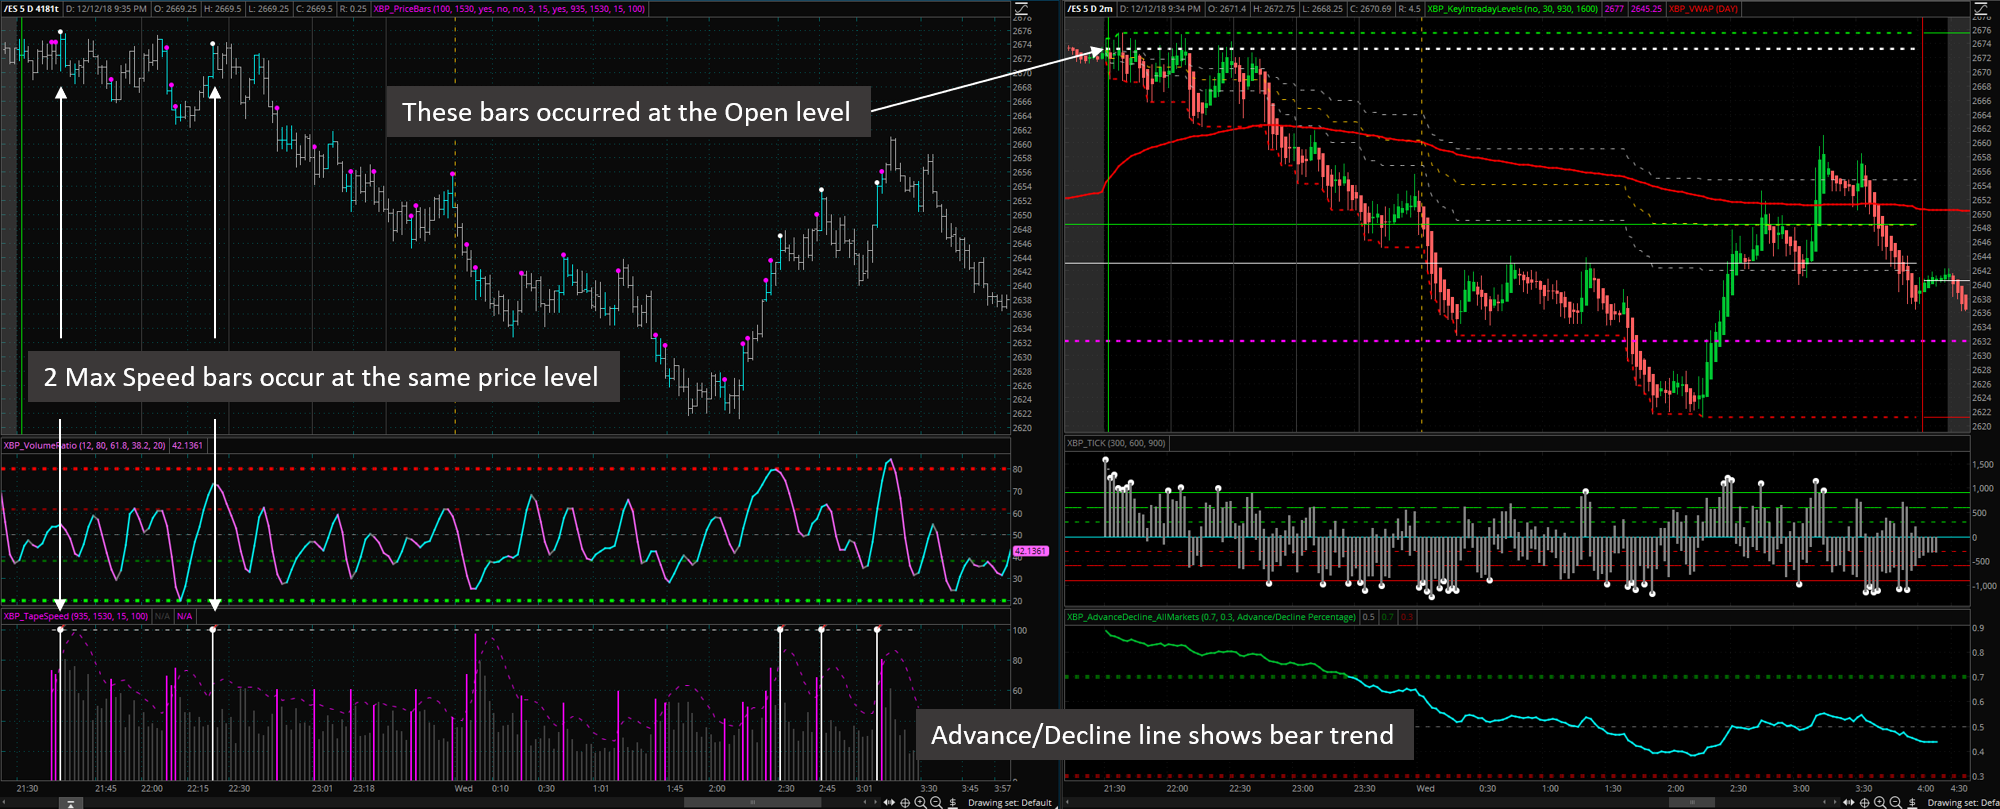
For additional context, the advance/decline line was clearly pointing a bear trend.
With all these information you can conclude that price tried to go above the Opening level, was faced with strong resistance from big players in the market (the ones able to speed up the tape significantly) and that price was about to start a trend downward to close the opening gap (horizontal green line at 2649 price level in the right chart). This trade would have yield a good profit 🙂
Getting the XBP Indicators
If you are interested in using the XBP indicators, simply send me an email and we will complete the transaction using PayPal. The price of all indicators for a life-time license is of USD 100 or just 2 E-mini points.
PayPal link: paypal.me/xbptrading
Why there is no a “Buy” button in the site? Well, because I’m not a company. My business is not to sell you indicators but to improve my trading every day. The revenue that I get from these indicators go to fund my online video-game library 😉

1 Comment