Today we had a strong bull trending day, after a convulted last week, the market pushed higher with force. These trending days could be quite tricky for some day traders for two main reasons. First it is difficult to know if we are in a trending day and second it is difficult to know when is a good time to enter.
The most common trading days are swinging days where action ranges from a lower bound to an upper bound in a flat or incline fashion. These days are suitable for strategies that try to identify trend changes at support and resistance levels and/or oversold/overbought levels. As these are the most common days, traders tend to fit any day action into a swing-day pattern. During a trending day, we will see multiple small corrections, which will be wrongly identified as trend changing areas where the trend-unaware trader will enter a position against the main trend hoping for a big move. Quickly the main trend will resume and the trade will be stopped, normally at a loss. This sequence will repeat until the trader realizes the market is in a trend or until a sound money management strategy tells the trader to quit for the day.
If you identify yourself in the previous scenario, then you need an easy way to identify a trend. The good news are that such way do exist. As part of the “Market Internals” indicators, the Advance-Decline indicator (A/D) can give us a clear clue of what kind of day we are heading into. As a short summary, the A/D indicator, used as a percentage, tells the percentage of stocks trading higher versus the ones trading lower. As the S&P500 is nothing else that an index of the market, it is obvious to think that the S&P500, and its futures contract, will follow the overall market trend or, what is the same, the overall A/D indicator trend.
I’ve been experimenting with the A/D indicator for many years and finally I came to the conclusion that for day trading S&P500 futures there are only 3 helpful readings to help us to categorize the type of trading day that we are in:
- Trending Up day
- Swinging day
- Trending Down day
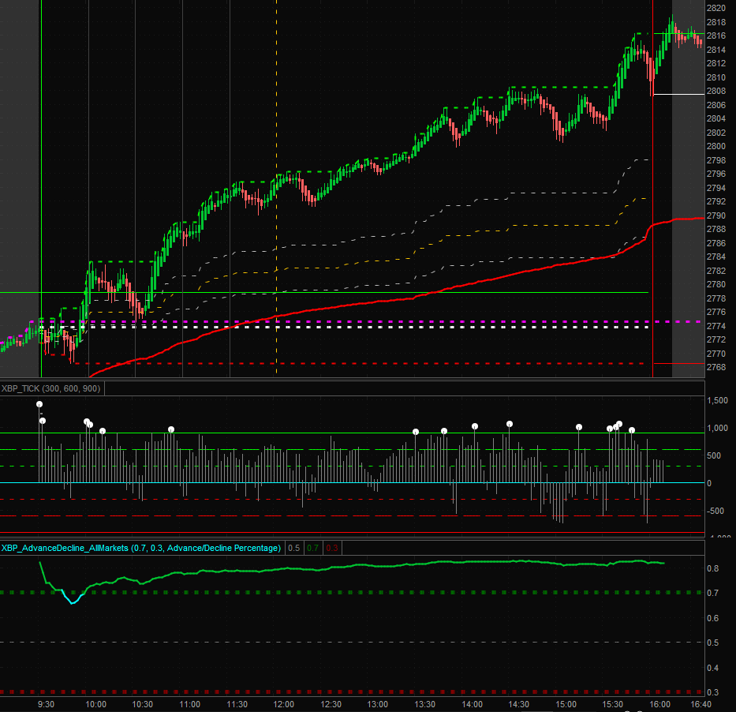
A Trending Up day is when A/D (as a percentage) stays over the 70% value:
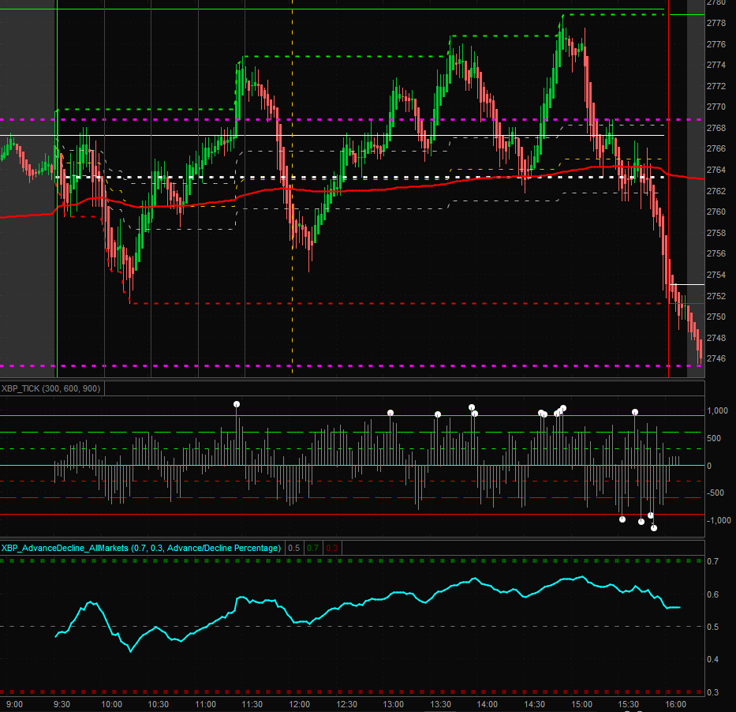
A Swinging trading day is when A/D ranges between 70% and 30%:
A Trending Down day is when A/D is below the 30% level:

You could be tempted to use A/D to identify trend changes, or any other intraday activity, but I discourage you of doing so. There are better indicator for such and A/D could be misleading when applied with fine detail. A/D is better suited as an overall broad market indicator.
To make things easier, I’ve coded my own version of the A/D indicator and colored the indicator green if it is above 70%, red if below 30% and blue if otherwise. As the base indicator is included for free in ThinkOrSwim, I want to share the “modified” version with you here for free as well:
declare lower;

input Advance_Level = 0.70;
input Decline_Level = 0.30;
input type = {default "Advance/Decline Percentage", "Advance-Decline", "Advance/Decline Line", "Advance/Decline Line (Daily)", "Advance/Decline Ratio", "Market Breath", "TRIN"};

def advances;
def declines;
def advvol;
def decvol;
advances = close("$ADVN") + close("$ADVN/Q") + close("$ADVA");
declines = close("$DECN") + close("$DECN/Q") + close("$DECA");
advvol = close("$UVOL");
decvol = close("$DVOL");

rec advnDecl;
def level;
switch (type){
case "Advance/Decline Percentage":
advnDecl = (advances / (advances + declines));
level = 0.5;
case "Advance-Decline":
advnDecl = advances - declines;
level = 0;
case "Advance/Decline Line":
advnDecl = advnDecl[1] + if !IsNaN(advances - declines) then advances - declines else 0;
level = 0;
case "Advance/Decline Line (Daily)":
advnDecl = (advances - declines) / (advances + declines);
level = 0;
case "Advance/Decline Ratio":
advnDecl = advances / declines;
level = 1;
case "Market Breath":
advnDecl = ((advances * advvol) - (declines * decvol));
level = 0;
case "TRIN":
advnDecl = ((advances/declines)/(advvol/decvol)) * -1;
level = 0;
}

plot AD = if !IsNaN(close) then advnDecl else Double.NaN;
AD.DefineColor("Up", Color.UPTICK);
AD.DefineColor("Down", Color.DOWNTICK);
AD.DefineColor("Normal", Color.CYAN);
AD.AssignValueColor(if advnDecl > Advance_Level then AD.color("Up") else if advnDecl < Decline_Level then AD.color("Down") else AD.Color("Normal"));
AD.setLineWeight(2);
AD.HideBubble();

plot "Mid Level" = level;
"Mid Level".SetDefaultColor(GetColor(7));
"Mid Level".setStyle(Curve.SHORT_DASH);
"Mid Level".setLineWeight(1);
"Mid Level".HideBubble();

plot "Advance Level" = Advance_Level;
"Advance Level".setStyle(Curve.SHORT_DASH);
"Advance Level".setdefaultColor(Color.DARK_GREEN);
"Advance Level".setLineWeight(5);
"Advance Level".HideBubble();

plot "Decline Level" = Decline_Level;
"Decline Level".setStyle(Curve.SHORT_DASH);
"Decline Level".setdefaultColor(Color.DARK_RED);
"Decline Level".setLineWeight(5);
"Decline Level".HideBubble();
Now you have an easy and reliable way to know in which kind of a trading day you are in, but we still need to identify good moments to enter the market to profit from the trend. As yesterday was a Trending Up day let’s have a look at the overall picture with the XBP Trading setup:
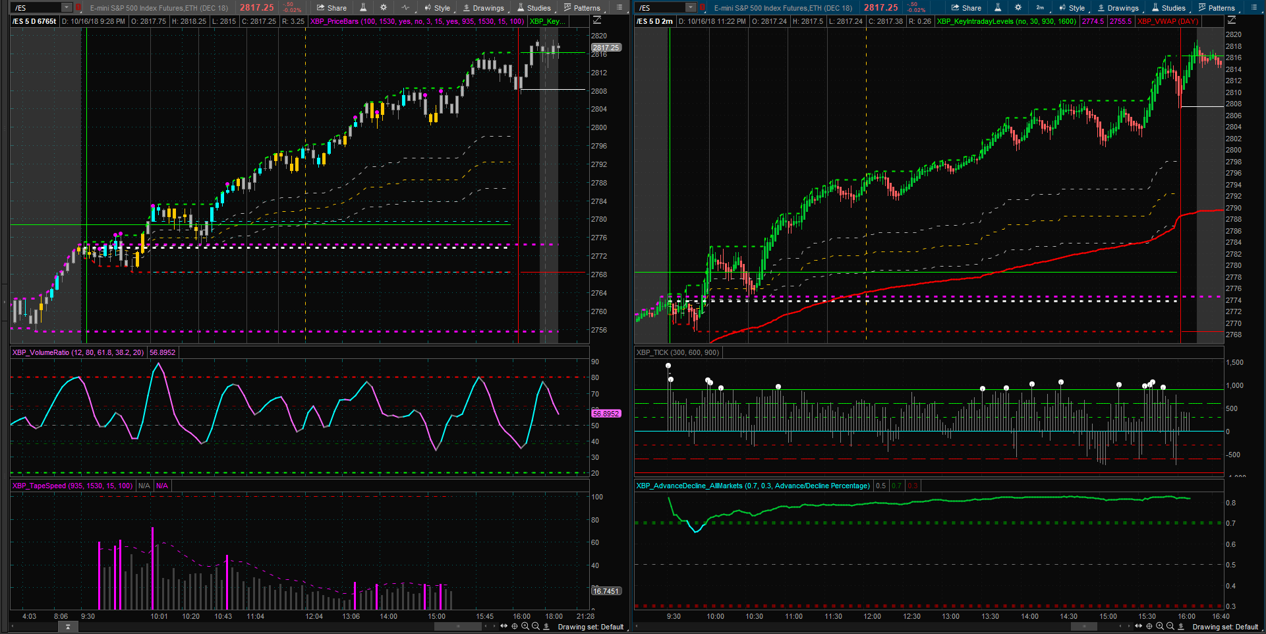
On the left we have the ticks chart with the XBP Trading indicators for high/low volume in the bars, the accumulated volume ratio and the bar’s speed. On the right is a 2 minutes chart configured with Heikin Ashi candles, the $TICK indicator and the A/D Percentage indicator from the code above.
Reading the A/D indicator, we can see that we are, clearly, in a Trending Up day, so we shall focus our attention to enter Long positions only. Using the XBP Volume Ratio, the oscillator indicator on the left chart, we can easily identify that good entry points to the trend are when the oscillator breaks above the 50% level (dotted grey line):
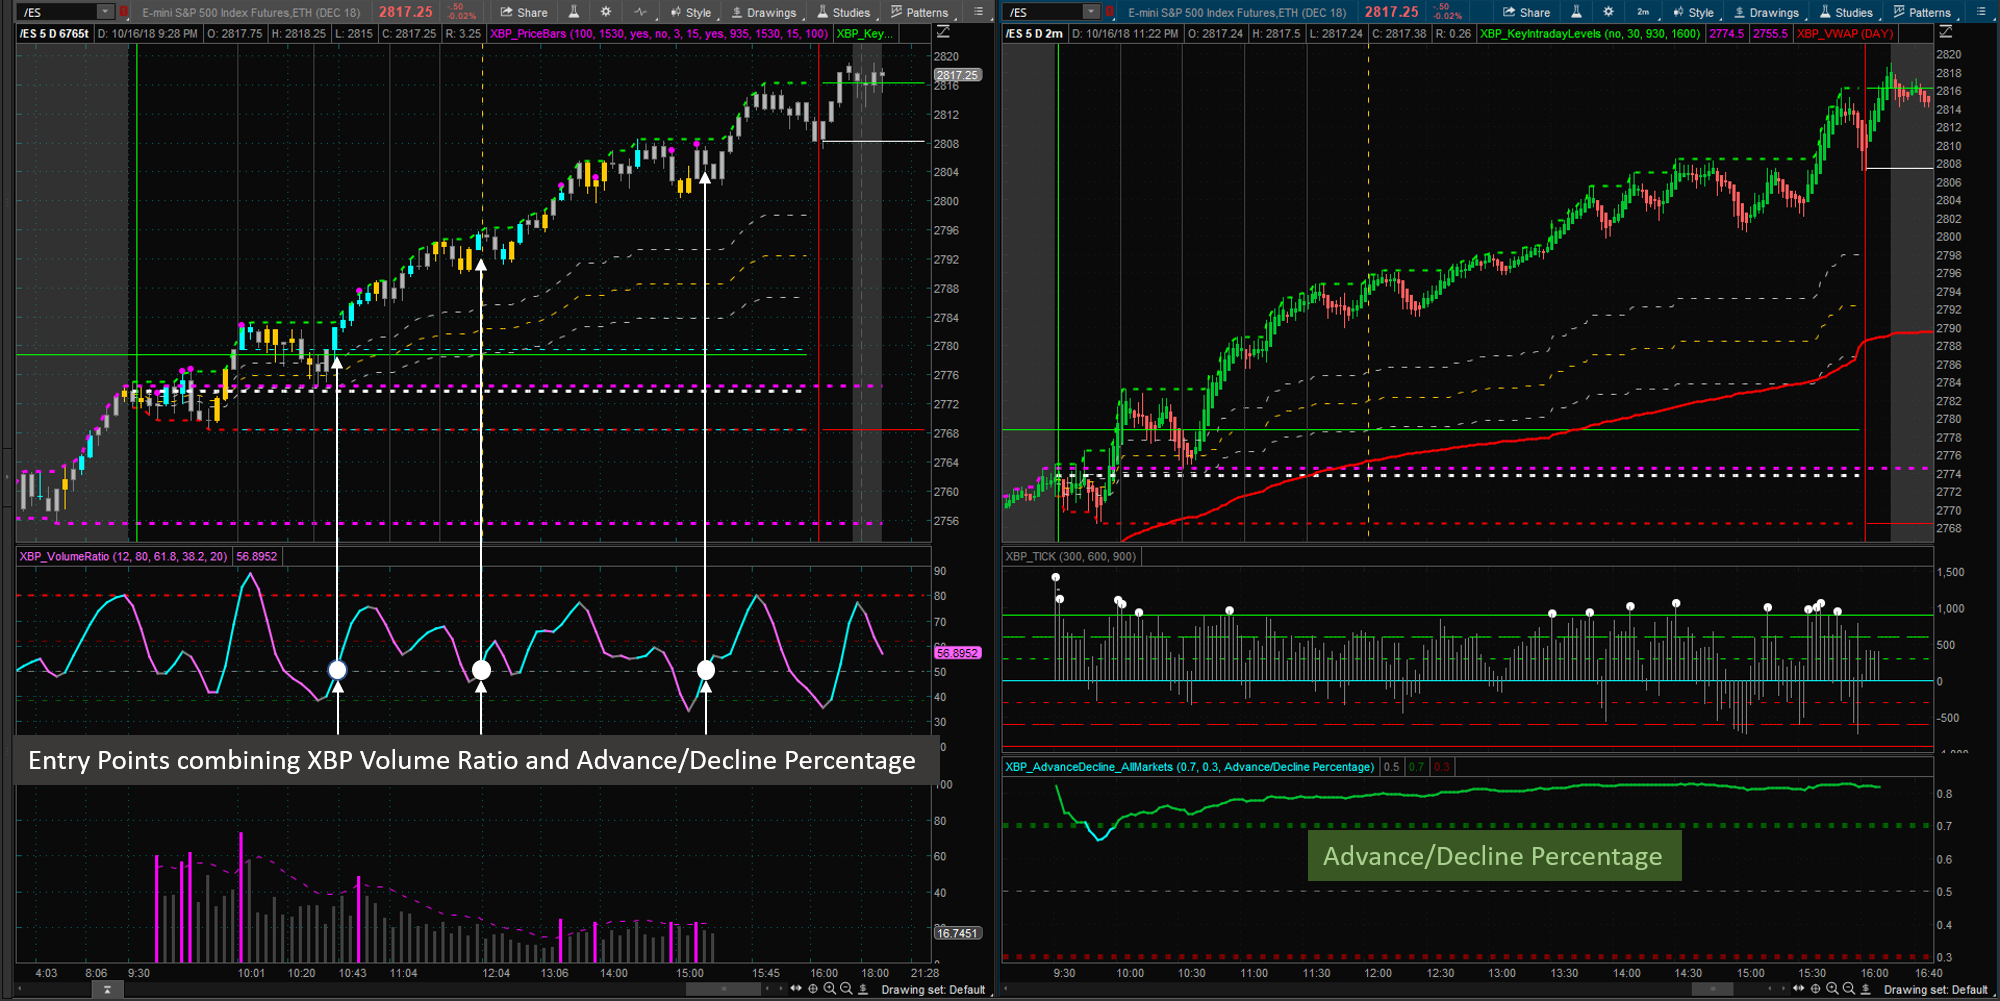
Please note that the first 30 minutes of the day are not taken into consideration as I don’t trade at that time (this is a lesson well learnt already).
The combination of a market breath indicator such as A/D with a volume based oscillator like XBP Volume Ratio, makes it easy to wait (one of the most difficult things to do in day trading) until a high-probability moment appears to enter the trend.
To Exit the trend you could opt for either of 2 strategies. You apply money management and once you have done X amount of points/money you exit the market. For example a fixed 4 points profit stop. Or you could stay in the trade until the XBP Volume Ratio approaches the 50% level. Either strategy will provide you with good profits without much stress.
Getting the XBP Volume Ratio
If you are interested in using the XBP indicators, simply send me an email and we will complete the transaction using PayPal. The price of all indicators for a life-time license is of USD 100, just 2 E-mini points 😉
PayPal link: paypal.me/xbptrading
Why there is no a “Buy” button in the site? Well, because I’m not a company. I’m just a trader. My business is not to sell you indicators but to improve my trading every day. The revenue that I get from these indicators go to fund my online videogame library 🙂
