As I’m adding a new indicator to the XBP bundle, the ALMA Cross Signal, I thought it would be a good time to do a summary of how all the XBP indicators look like together on a single screen and to do a brief summary of the use of each indicator.
Here is the how the screen looks like:
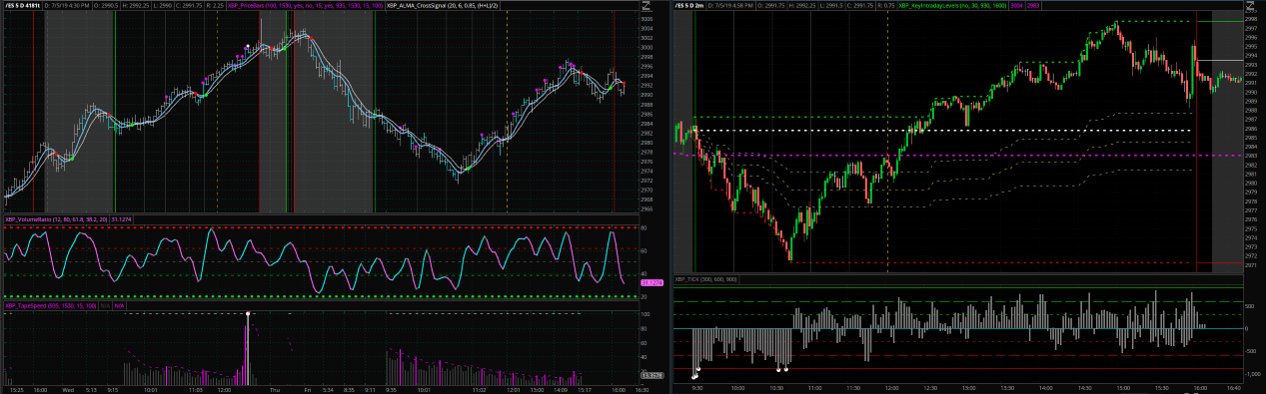
There are two main screens, the one on the left is a 4181 ticks chart, while the one on the right is a 2 minutes chart.
The indicators on the ticks chart screen are:
The indicators on the minutes chart screen are:

The reason to use two different time configurations, ticks and minutes, is mainly due to two indicators. First the Tape Speed indicator in the ticks chart, which only works on a ticks chart or any other chart where the time to complete each bar is different from bar to bar. Second, the $TICK indicator in the minutes chart, which only works on a time based chart, as the underlying data is provided only in time units.
Now, let’s have a brief summary of each indicator. The more complex indicators have already had their dedicated post in this blog. You can find more detail information by consulting the ThinkOrSwim Indicators section of this blog.
In both charts, the “Vertical Time Line” indicator. This indicator adds vertical lines at key times during the day. By default it plots the Open, Noon and Close, but it has already defined lines for every half an hour during the day and each line can be adjusted to any other time.
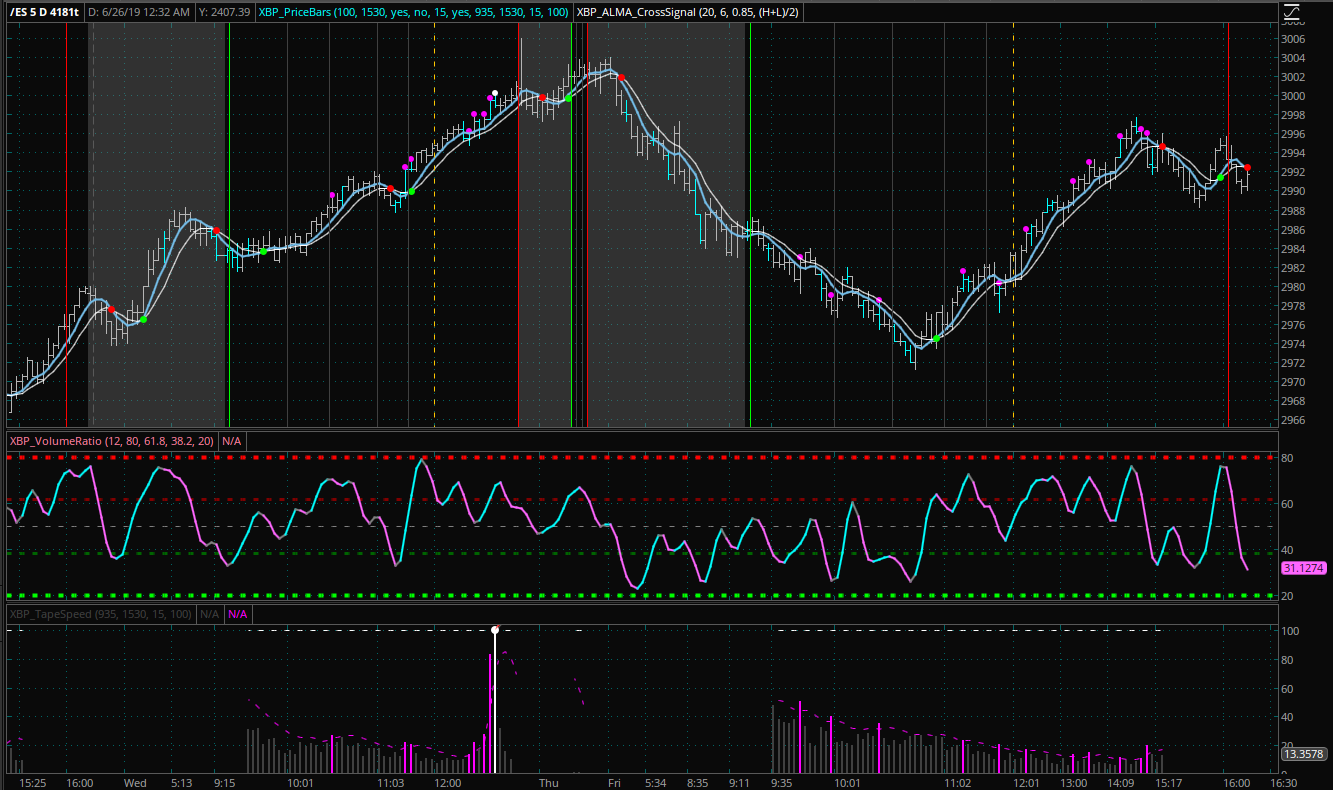
In tick chart, the “Price Bars” indicator. This indicator paints the price bars to identify in which bars there has been a relatively high (blue) or low volume (yellow). I have the low volume indicator disabled as I’ve found that it is of no use to me. You can check to see if you can spot something that I don’t.
The “new” kid in the block in the tick chart, the “ALMA Cross Signal”. Previously I shared the ALMA indicator for free in this blog. You can go and get the code there for yourself. In this indicator what I’ve done is to add a trigger line, which is derived from the ALMA line, and then to plot a buy (green) or sell (red) signal when the two lines cross each other. This is a basic moving average indicator, but because it uses ALMA as the background calculation it suffers from less false signals than other similar indicators.
Below the price chart in the tick charts, the first indicator is “Volume Ratio”. This indicator infers the volume data from the price action, accumulates and smooths the data and finally plots it as a line chart. This indicator normally predicts the price action as it suffers from what we could say “negative” lag. As we are used to lagging indicators, having one that is just the opposite gets a bit of time to get used to it. The main signal that you are looking in this oscillator is a divergence with price, where price is making, for example, a higher high but the indicator is making a lower high. This is a bearish signal where the indicator is anticipating a high probable bearish turn of the price.
Finally in the tick chart, the last indicator is the Tape Speed. This indicator only works on a non-time based chart where the time that takes to close a bar is different from bar to bar. The indicator calculates the “speed” of each bar and plots a histogram. The higher the speed the higher the bar.

On the time chart, the one on the right, we have the “Vertical Time Line” indicator already discussed, and then the “Key Intraday Levels”. This indicator plots those key price levels that seem to affect so much the intraday price action. Those levels are yesterday’s high, low and close; overnight high and low; today’s open, high and low; open range high and low; and finally the 38,2, 50 and 60 percentile levels dynamically calculated from today’s high and low.
The last indicator, is the TICK indicator, which is based on the data available in the $TICK indicator from the market. This indicator tells you the buying and selling pressure that occurs in the market at any moment (time based). The theory is that extreme levels (>800) can signal exhaustion and possible high/low. The $TICK indicator default data is difficult to plot and analyze, the XBP TICK indicator makes it easier… way easier.
And that’s all! All of them are included in the XBP Indicators bundle and as they are ThinkOrSwim indicators you can even get access to the source code and tweak whatever you would like.
Getting the XBP Indicators
If you are interested in using the XBP indicators, simply send me an email and we will complete the transaction using PayPal. The price of all indicators for a life-time license is of USD 100, just 2 E-mini points.
PayPal link: paypal.me/xbptrading
Why there is no a “Buy” button in the site? Well, because I’m not a company. I’m just a trader. My business is not to sell you an indicator. The $100 is just an appreciation token for all the time that I dedicated to craft the indicators and to write this blog 🙂
