Review of market action for the week of 22nd to 26th of February 2016:
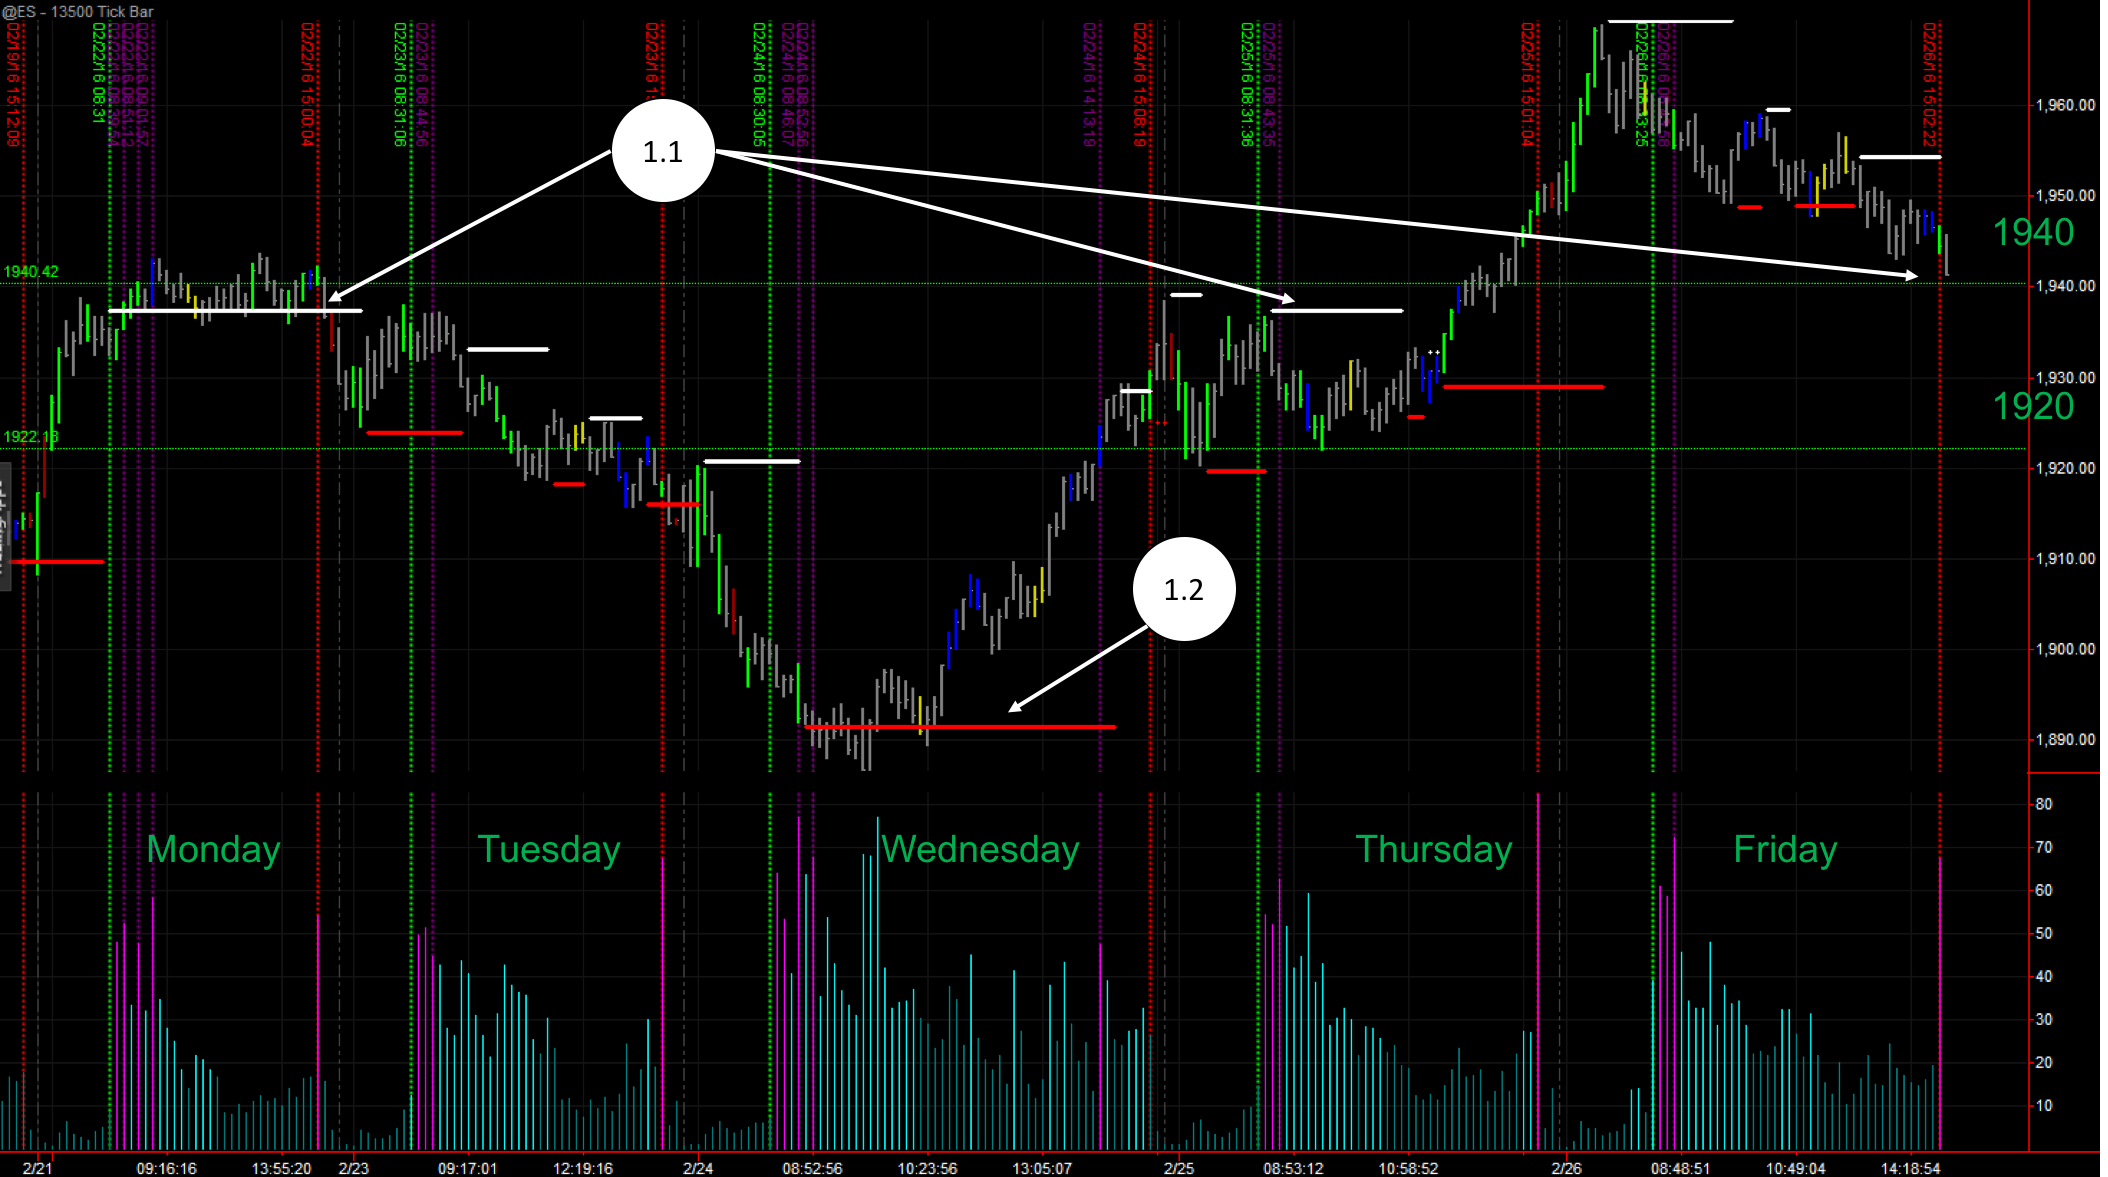
To review the action of the whole week we use a 13,500 ticks chart and reduce the indicators to only XBP Bulls and Bears Support and Resistance (BB SR) Level Upper, XBP Market Players and XBP Key Market Times. We recommend to keep this screen always open during your day trading to give you context of the action over the span of the last 5 trading days.
XBP BB SR Level Upper help us to identify the levels where the market forces flipped from one side to the other, for example a red line marking a support is when the bulls take over the bears. XBP Market Players highlights with blue and green bars the levels at which the big players have entered the market. With both these indicators we can easily identify the main support and resistance levels based on volume action. XBP Key Market Times help us to split the intraday session from the normal trading hours session.
Key levels identified:
(1.1) 1940: Already identified in past weeks, 1940 was the resistance to beat this week. On Monday the whole day the market couldn’t surpass this level with a long resistance printed in the 13,500 ticks by the XBP BB SR Levels indicators. Finally in Thursday, with a lot of volume bars, 4 blues and 2 greens, the market crossed this level. Friday saw the market falling back to 1940.
(1.2) 1890: Wednesday saw the bottom of the week with a clear support printed by XBP BB SR Levels indicator. The highest tape speed action for the week was also seen at that level, revealing smart money entering the market in small orders, trying to disguise their volume. In this type of action is important to remember the advantages of the XBP indicators when playing together.
XBP Tape Players (the indicator that paints the bars green, blue or yellow) measures the average trade size per operation (or tick). If big players enter the market with big orders you will see blue bars, or green bars (green bars are the biggest volume recorded to the day so far). Yellow bars will be printed when the opposite happens, below average volume is recorded, signalling ‘No Demand’.
XBP Tape Speed (the histogram indicator at the bottom), measures the speed at which each bar is closed. Remember that in tick charts, each bar can take a different time to close. If a bar closes considerably faster than the average that bar is painted purple. One of the reasons a bar can close faster is that many orders are entered in a short period of time. This could signal a big player entering a big number of 1 lot orders. This big player will try to avoid any volume based indicator that could detect his large order, but it cannot avoid a tape scanning indicator like XBP Tape Speed that will catch the fast stream of orders entering the market.
Outlook for next week:
I’m expecting a test of 1940s, or even 1930s where all those big volume bars where, and after that the market to continue upwards until the next resistance. But as I don’t have a very clear picture I escalated on time higher to 40,500 ticks (13,500 * 3), to see the picture from a step above:
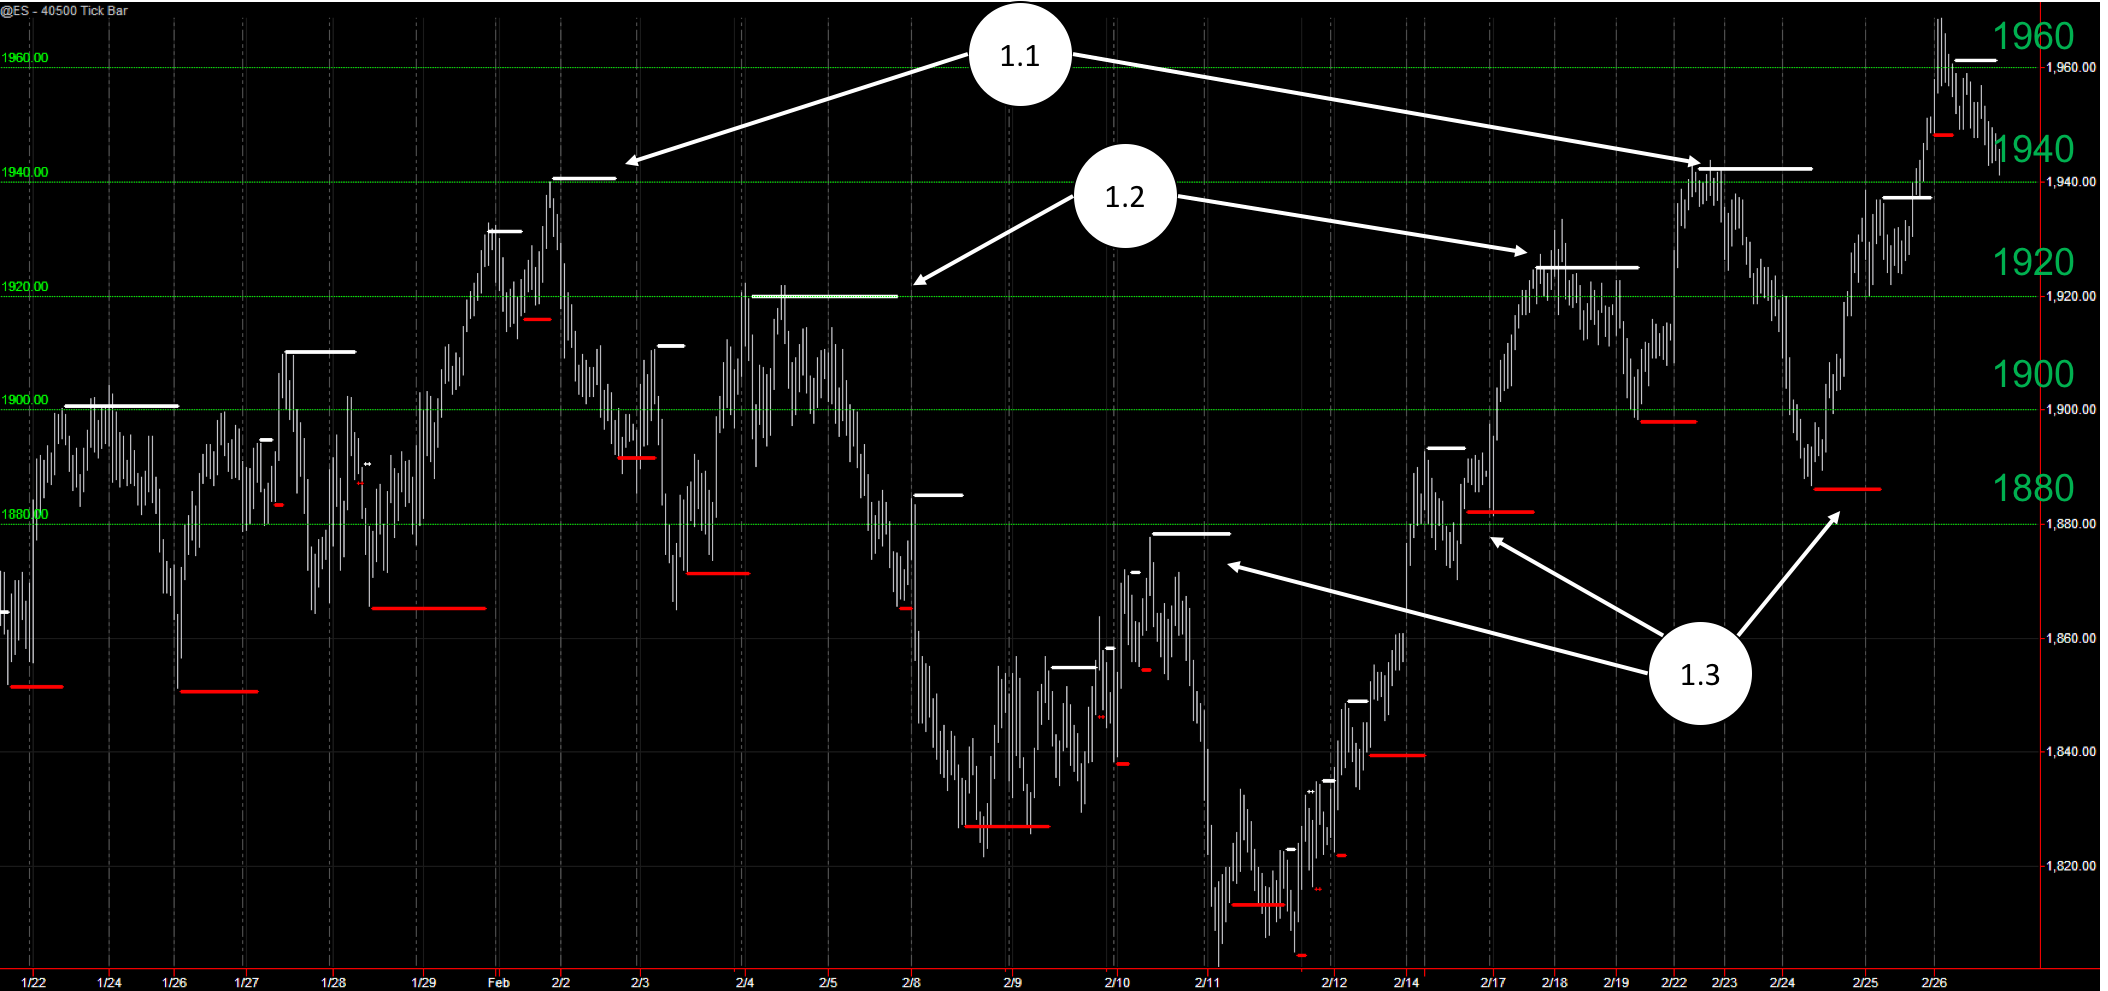
The 40,500 ticks chart starts goes from the 22nd of January 2016 to the 26th of February.
Here you can see the 1940 (1.1) and 1920 (1.2) levels playing resistance twice and 1880 flipping from resistance to support.
If the rally is to continue, we will see a change from resistance to support of 1940 or even 1920. We will keep an eye on this time level.
And last but not least, I’ve highlighted in this chart the levels every 20 points. I have this crazy theory that $ES_F moves in steps of 20 levels each time. You can check it out by yourself (click on the chart to make it bigger).
