
Down day with price going back to the key level of 1940 by bouncing off VWAP (thick red line) as an intraday resistance. Other key intraday support and resistance level have been the Opening Range Low at 1955 (in the chart as OR L in purple), and the Intraday Session Low at 1950 (in the chart as IL in cyan).
The XBP Bulls and Bears Support and Resistance Levels (XBP BB SR) indicator gave us, once more, accurate readings of the forces in the market and revealed the key support and resistance levels and turning points. Special mention to the (1.1) highlighted levels during the intraday session. It is no coincidence that these two levels acted as support and resistance for the rest of the day at (1.2) and (1.3). It’s interesting to see how the combination of the Intraday Session Low level and the XBP BB SR supports at (1.3) marked the major support for the day that needed special volume to be broken (2.2 below).
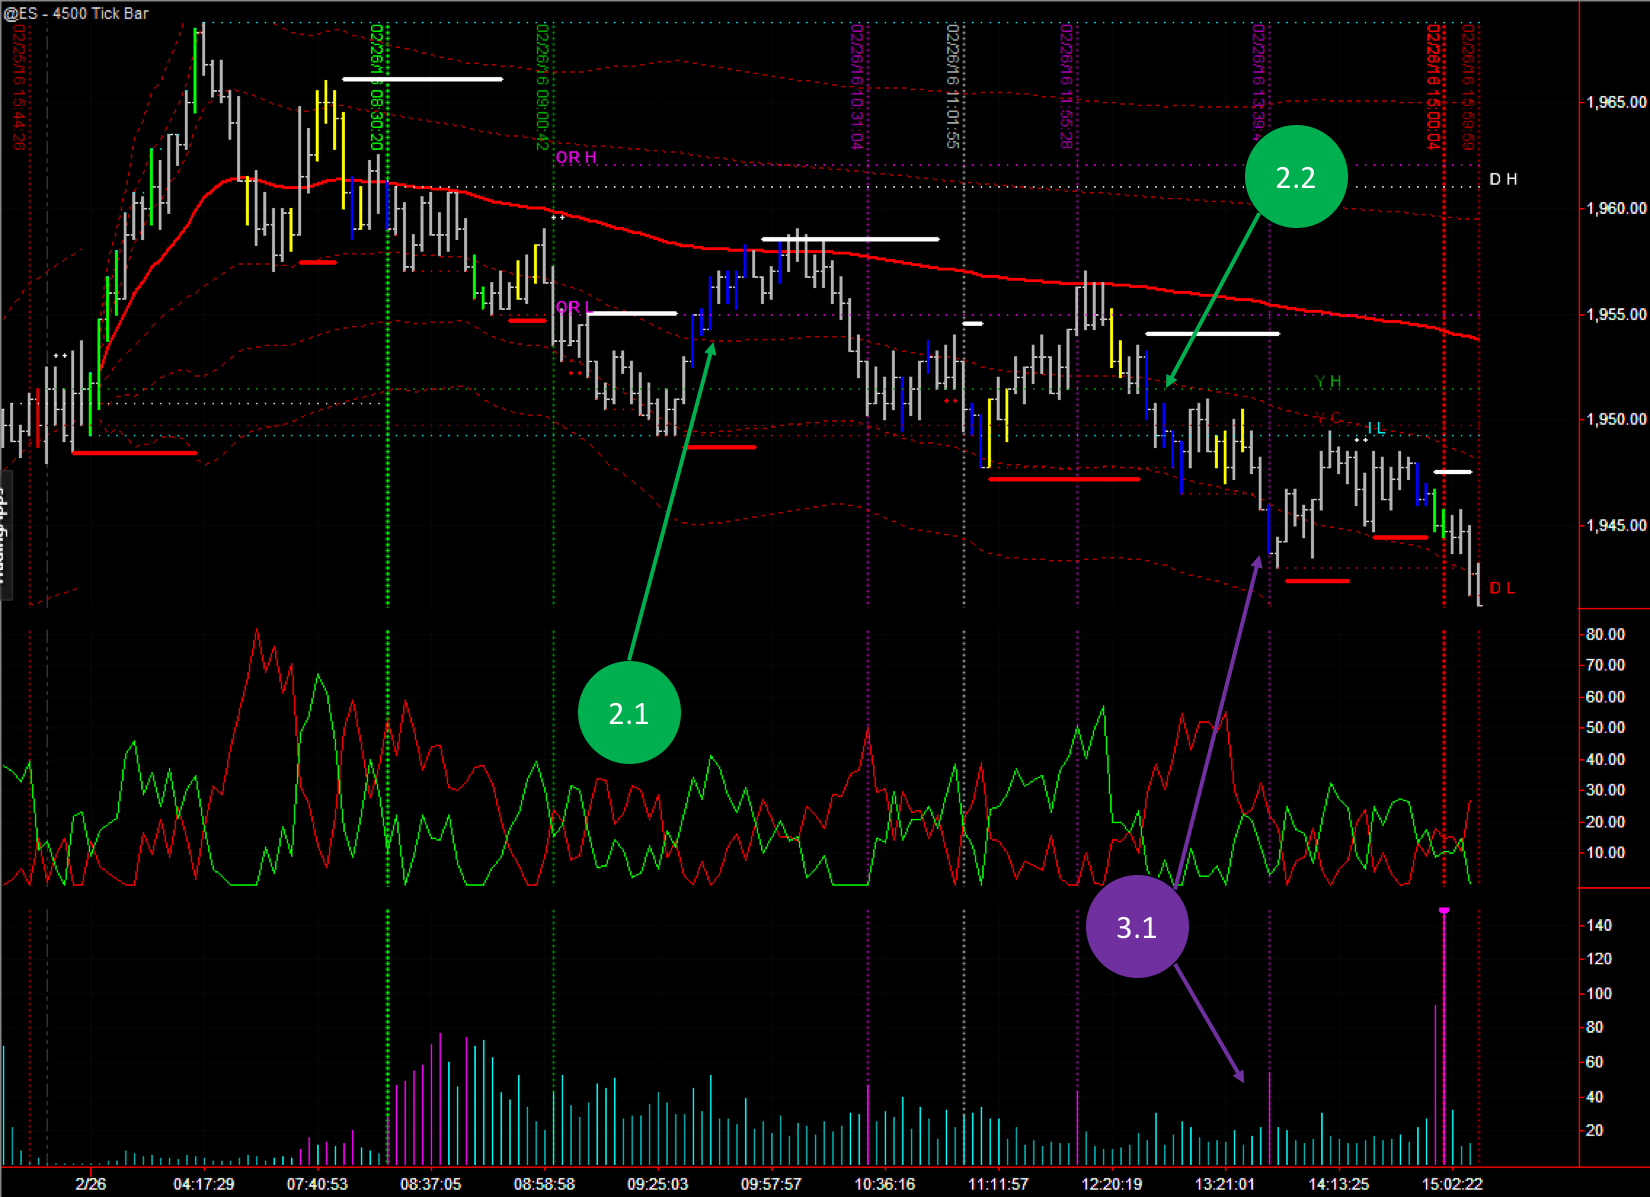
As per volume action we saw two major areas. Big money getting short at (2.1) and pushing the market lower at (2.2) and breaking below the XBP BB SR support of 1950.
Point (3.1) is a typical market bottom. Here you have the 3 indicators signalling extreme action. A blue bar that reveals big volume entering the market, a purple tape speed bar that shows that the action has been relatively fast (if you check the bar itself you can see that the speed was more than the double from near bars), and finally a support in the XBP BB SR indicator. Remember that you need at least 2 of the indicators to align to mark a reversal. For example, in point (2.2) only high volume blue bars are shown, no extreme tape speed and no XBP BB SR turning point, so the action continues lower until (3.1).
Hope your trading went well and you see the value of the XBP indicators.
