The XBP Indicators run on TradeStation 9.1 onwards and have been extensively tested with e-mini futures (@ES) i 4,500 ticks charts. Let’s go step by step:
Note: We are assuming that you already have TradeStation installed and working with a live feed of @ES futures symbol. If you need help on setting up the basics of TradeStation you can contact their support services here.
(1) Create a new Workspace and add a new Trading App of type Chart Analysis. Right click on any black space and select ‘Format Symbol’:
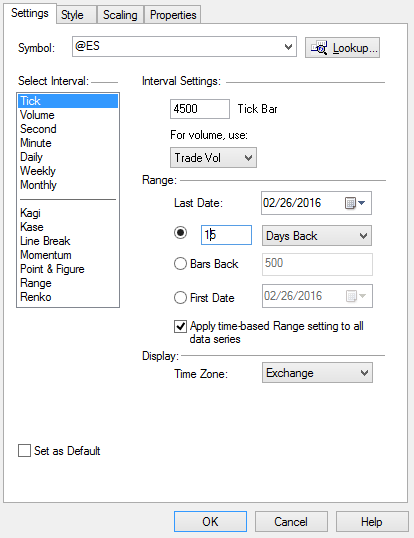
Do the following changes:
- Symbol = @ES
- Interval = Tick
- Interval Settings = 4500
- For volume, use = Trade Vol
- Last Date = 15 Days Back
- Time Zone = Exchange
Why ticks?
Let’s first start by what are ticks. Every time there is a transaction in the market, for example a buy operation of 5 contracts, there is 1 tick. 1 tick = 1 operation.
This is quite different from a time based (1 minute, 5 minutes, etc.) charts, where regardless of the market activity a new bar is drawn every X minutes. In a 4,500 ticks bar chart, one bar will need 4,500 operations to be completed. The time to complete a 4,500 ticks bar can be completely different from one bar to the next.
Another key aspect is volume. One operation (or tick) happens for Y amount of contracts. For example, there is one operation to buy 5 e-mini contracts at 1922 level. This operation is marked as 1 tick with 5 contracts of volume. Again, 1 tick with 5 contracts of volume.
Adding these two concepts together we have that each tick bar will take the same amount of ticks to complete, in our case 4,500, but it will take different time and with different volume. This difference in time and volume opens the doors to indicators that will analyse the fluctuations in both volume and time-to-complete (or speed).
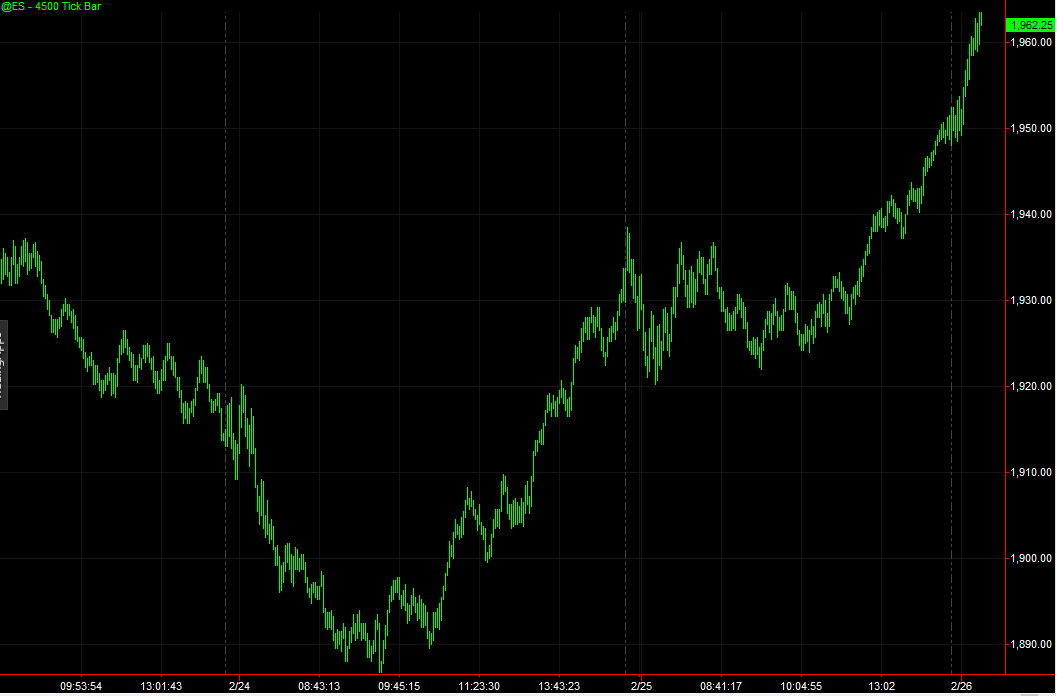
Your resulting window shall look something like this:
Now we will proceed to add the XBP Indicators. First you will need to subscribe to them in the TradeStation here.
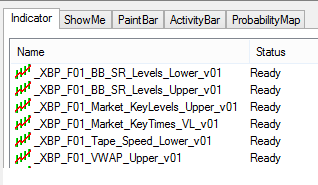
Once you got the indicators installed in your TradeStation just simply right click any black area in the chart and choose ‘Insert Analysis Technique’.
In the ‘Indicator’ tab choose the XBP Indicators:
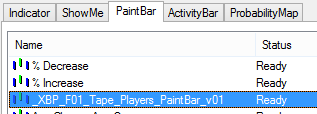
In the ‘PaintBar’ tab choose the XBP Indicator:
The resulting window will be something like this:
This is too overwhelming, but no worries that now we will learn to make it less so.
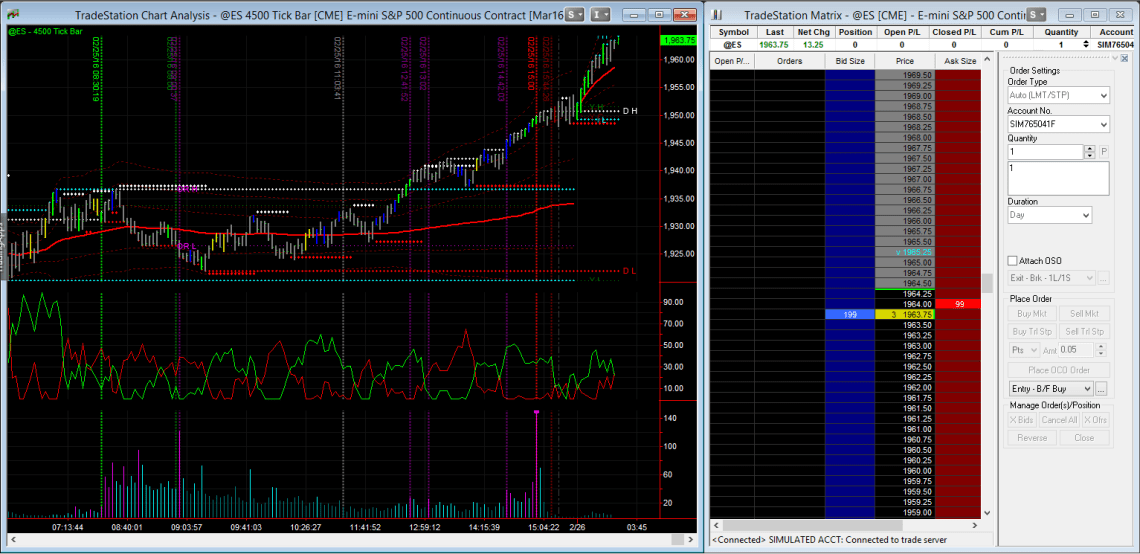
First we will need to setup our day trading screen. Add to your workspace a second Trading App of type ‘Matrix’. Then, click in the ‘Window’ menu and choose ‘Arrange Vertically’. Adjust the zoom of the chart to show you just the right amount of time for you to trade without having a too overwhelming experience. Something like this:
Now you can start customising the width, size and colours of the indicators so they adjust to your preferences.
One last thing you shall do is to change the default colour of the price chart. By default is bright green, but as the XBP Tape Players indicator is a Paint Bar indicator that uses as default colour grey, you will need to change this setting to. To do this just follow these steps:
- Right click on the chart and choose ‘Format Symbol’
- Go to ‘Style’ tab and change the Regular Session colours to grey
- Click Ok

Now the chart will look much better.
Now the next action will be to create a secondary Workspace where we will have a cleaner version of the screen and a bigger time frame.
Add a new Workspace, but instead of adding a new window, we will bring the one that we already configured. For that just go back to the first Workspace, right click on the chart and choose ‘Copy Window’. Now, go to the secondary Workspace, right click anywhere and choose ‘Paste Window’.
To have a cleaner view, right click in the chart and choose, ‘Format Analysis Techniques’. A new window showing all the XBP indicators will show up. Now we will change the ‘Status’ of few indicators that we will not need in this higher view:
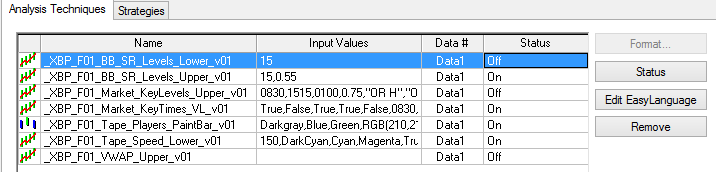
To change the Status from On to Off just click on the indicator and then click on the ‘Status’ button. An Off Status makes that indicator inactive in the chart.
Once you have finished, copy the window again and paste it on the same Workspace. Then right click on the new window, choose ‘Format Symbol’ and change from 4500 ticks to 13500 ticks (4500 x 3). Finally arrange the Windows Vertically to have the following screen:
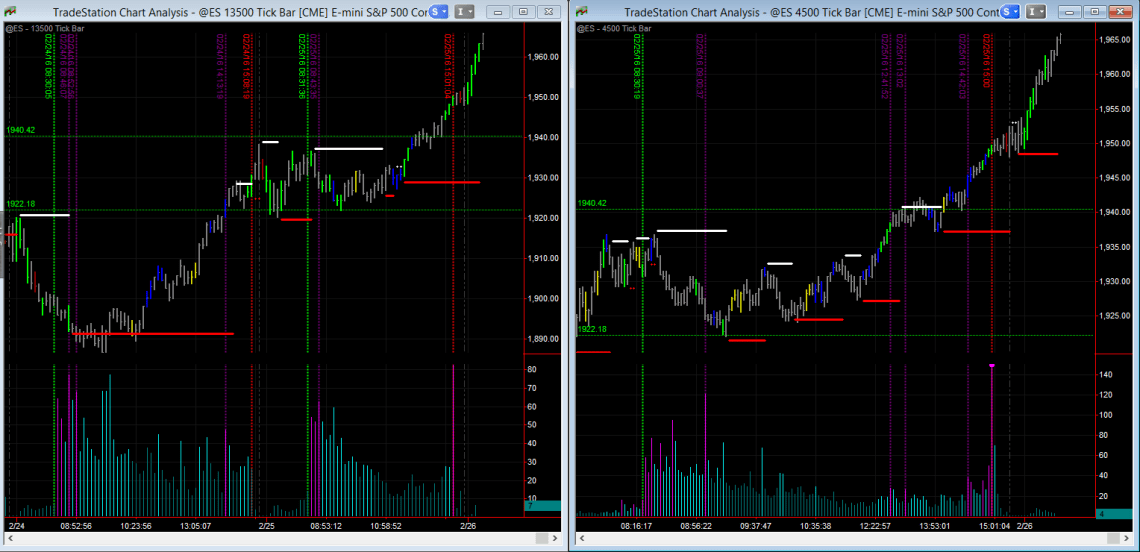
This cleaner screen allows you to see the big action clearer. The 13,500 ticks chart is used in our Weekly Reviews, while the 4,500 ticks is used in our day trading and reviews.
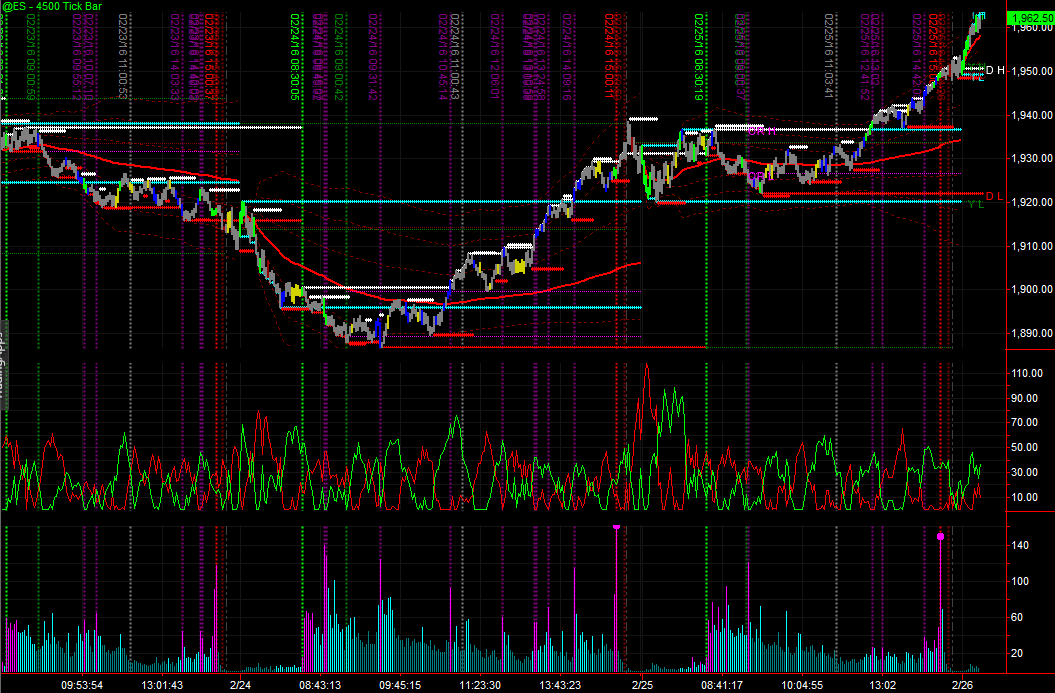
The first window that we created, with all the XBP Indicators will become useful to you when you want to time your entry better or you want to see where the key levels are, like VWAP, Open Range High and Low, etc. Playing a bit with the colours and the indicators settings you can end up with a screen similar to the one that I use:
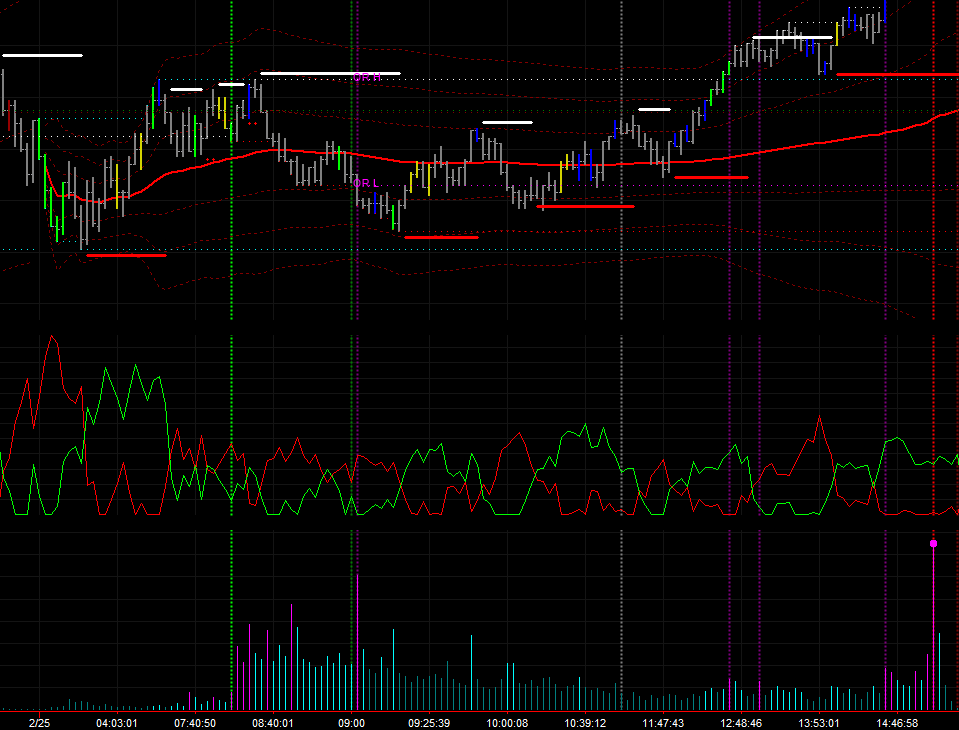
As you can see there is less visual stress but still all the information available.
Hope this helps to jump start you in the use of the XBP Indicators.

2 Comments