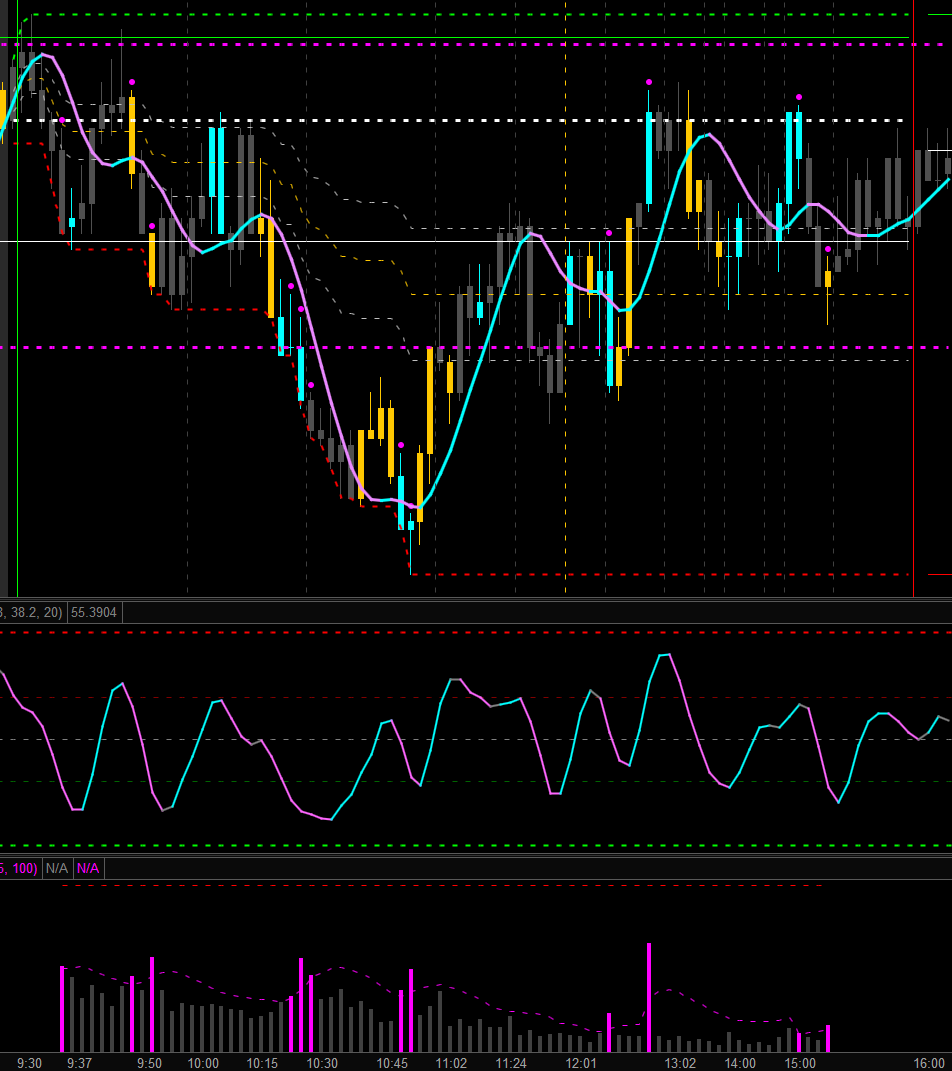
This is Friday’s 27th of April 2018 market action in a 4181 ticks chart using XBP Indicators. Today the action has been “by the book” technical. Major support/resistance levels have played well, the “dead cat bounce” pattern has also played as expected and volume has given the right clues to anticipate price action accurately.
Let’s analyze 4 key moments, highlighted in this screenshot:

@ 1: Few minutes after 10:00am big players volume enter the market while price cannot cross the resistance level that is today’s open (thick white dotted line). We can see how price tries few minutes later to break the resistance and fails again.
@ 2: When price approaches the overnight low (thick purple dotted line) volume increases (blue price bars) as well as speed (purple dots on top of the price bars as well as seen at the very bottom histogram chart). This could mean that stops are being hit and even more new volume is entering the market to push prices below the support level that the overnight low is.
@ 3: Price has formed the “dead cat bounce” pattern and the increase in volume and speed marks its end. Big players either exit the market for the day or reverse their positions. XBP Volume Ratio indicator shows a strong divergence with price and anticipates a high probable market turn.
Note: Yellow price bars occur when the average volume per bar is relatively lower. When you see one or two blue bars surrounded of yellow bars a high probability top/bottom has been formed.
@ 4: At 12:30pm big volume bars and speed reappear signaling a new entry of volume that will push prices up to the opening level where another high volume and high speed bars indicates the end of the intraday rally. XBP Volume Ratio shows a second divergence with price pointing the most likely price direction. Important to note that this last action occurs between two key support/resistance levels, yesterday’s close (white line) and overnight’s low (purple dotted line).
As a summary, we need to evaluate price action in the context of key support/resistance levels and trend lines and analyze volume and tape speed action at those key levels. With the combination of price context and volume analysis we can enter high probability trades with confidence. I personally use the Hull Moving Average (bi-color moving average seen in the screenshots) as the entry trigger for my trades and a fixed stop loss and profit target.
Hope this helps to improve your trading.
