Strong directional moves are the ones that we can profit the most, if we enter in the right direction of course. Ideally we would like to know when those movements start and specially when they are about to finish. A mix of chart patterns and volume analysis can give us some high probability clues to help us in our trading.
On Friday the 20th of April 2018, the morning session in the S&P 500 futures (e-mini) did what is known as a Dead Cat Bounce. This pattern occurs on a strong down move and consists of a small recovery after a big drop to continue with a second drop move that goes at least down to the previous low if not lower. Something like this:
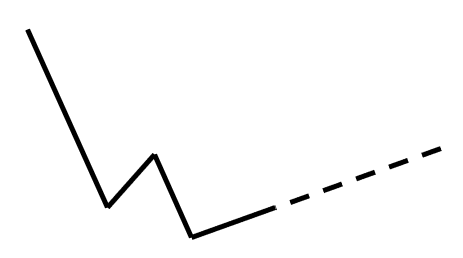
As this is a well known pattern, you shall expect it to complete so you can trade it. Also you can benefit from this knowledge by avoiding entering short at the wrong moment.
Volume analysis can give us the confirmation signals that this is indeed the movement that is developing. Let’s have a look:
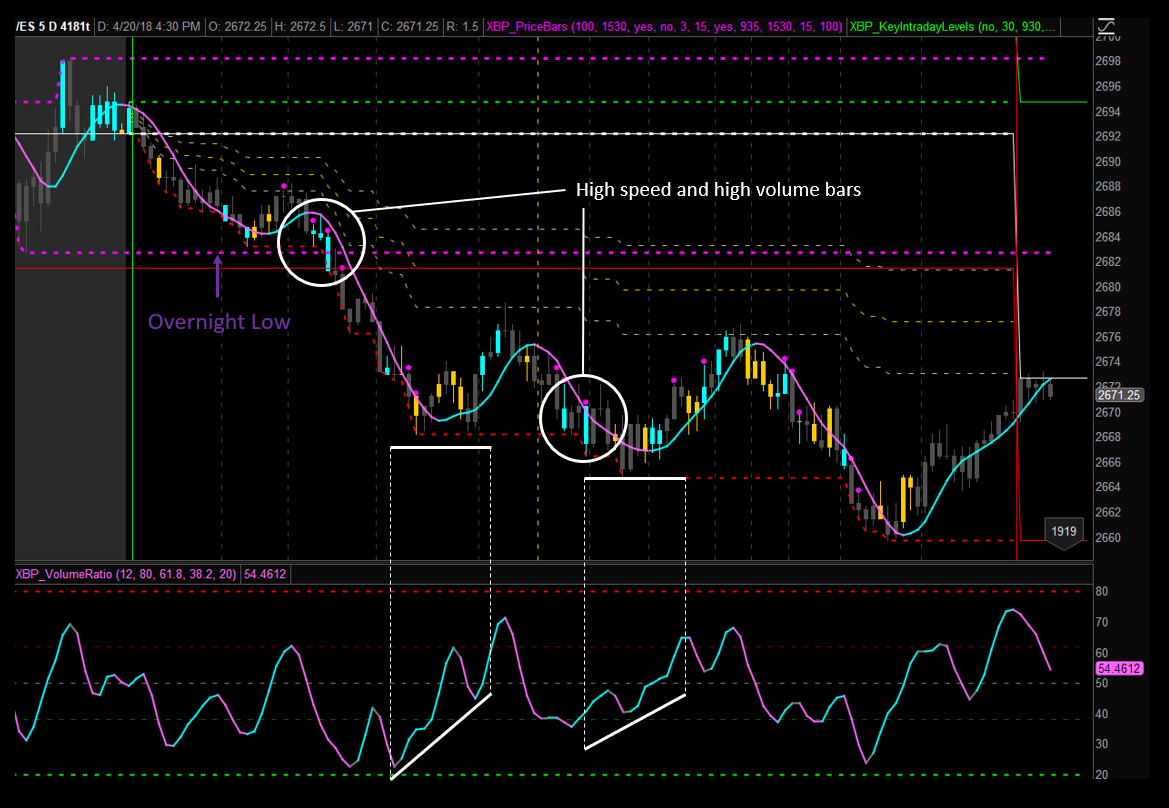
The screenshot is a 4181 ticks chart for the 20th of April 2018 session as seen in ThinkOrSwim with the following technical indicators:
- Vertical lines: Every 30 minutes, starting with the green vertical line at 09:30 and followed by the dotted gray lines. The dotted yellow line marks noon.
- Horizontal lines: Key levels like yesterday high, low, close, overnight high and low, day open, high, low and 3 Fibonacci retracement levels (61.8, 50 and 38.2).
- Hull Moving Average: This is my only price trend indicator. The good thing about the Hull Moving Average is that you don’t need two lines, one is enough.
- XBP Price Bars: To color the price bars blue when there is higher than average volume and yellow when lower. Also prints a purple dot when the bar has been completed faster than average (remember this is a tick bars chart).
- XBP Volume Ratio: Aggregated volume analysis oscillator that serves as a leading indicator for future price action.
We can see how volume and speed spikes when crossing the overnight low level signaling the start of the downwards movement. We can enter short here and stay in the trade until we see either a divergence between price and XBP Volume Ratio or a change in the price trend in Hull Moving Average (at the end of the day price pays the bills!).
Between 11:00 and 11:30 the divergence between price and XBP Volume Ratio appears together with the change in trend in the Hull Moving Average. Here it will be a good time to exit our short trade. We could have easily profited 10 points in this trade but this will depend on your money management strategy.
Between 11:30 and noon we see new high volume entering the market and price finding resistance at the 38.2% Fibonacci day retracement level. Here we could assume that professional trades have spotted the possibility to trade a Dead Cat Bounce movement and that they will enter new short positions to bring price lower. This is indeed what happens and we can see how a bulk of volume appears again when the previous low is achieved. See also that this volume comes with high speed dots, signaling either stops being hit and/or algos doing their job.
I don’t trade the rest of the day as it is a total different game many of the times and is too late in my time zone.
I hope this post helps you to improve your trading. If you are interested in using the XBP indicators, simply send me an email (xbptrading@gmail.com) and we will complete the transaction using PayPal.
The price of all indicators for a life-time license is of USD 100, just 2 E-mini points 😉
PayPal link: paypal.me/xbptrading

1 Comment