Last week’s identified levels were 2488, 2470, 2460, 2445, 2436 and 2405.
- 2460 acted as the low of Tuesday 15th.
- 2445 was crossed with high tape speed during the down turn on Thursday 17th and later acted as a SineWave PullBack level (see 4,500 ticks chart below).
- 2436 (actually 2438) acted as the high and reversal point of Friday 18th.
This week charts and levels are:
4,500 ticks chart
![2017-08-21 17_20_47-Paper@thinkorswim [build 1904.15]](https://xbptrading.com/wp-content/uploads/2017/08/2017-08-21-17_20_47-paperthinkorswim-build-1904-15.png)
Key support and resistance levels: 2474, 2460, 2438, 2420.
Note: Remember that levels are not precise levels. Add a 2-3 points above and below for the area of support/resistance.
Daily chart
![2017-08-21 17_22_46-Paper@thinkorswim [build 1904.15]](https://xbptrading.com/wp-content/uploads/2017/08/2017-08-21-17_22_46-paperthinkorswim-build-1904-15.png)
Added 2403 and 2366.
Note that price has broken below 2 support levels, the Trend line that touches all the lows since the beginning of the calendar year; and the latest SineWave support level.
Prediction: First time that we see price breaking below a SineWave support level since the beginning of the year. This could mark the start of a correction period where we can see the market heading lower/sideways.
By the way… I think I’ve found something interesting with this new volume based indicator that I have developed:
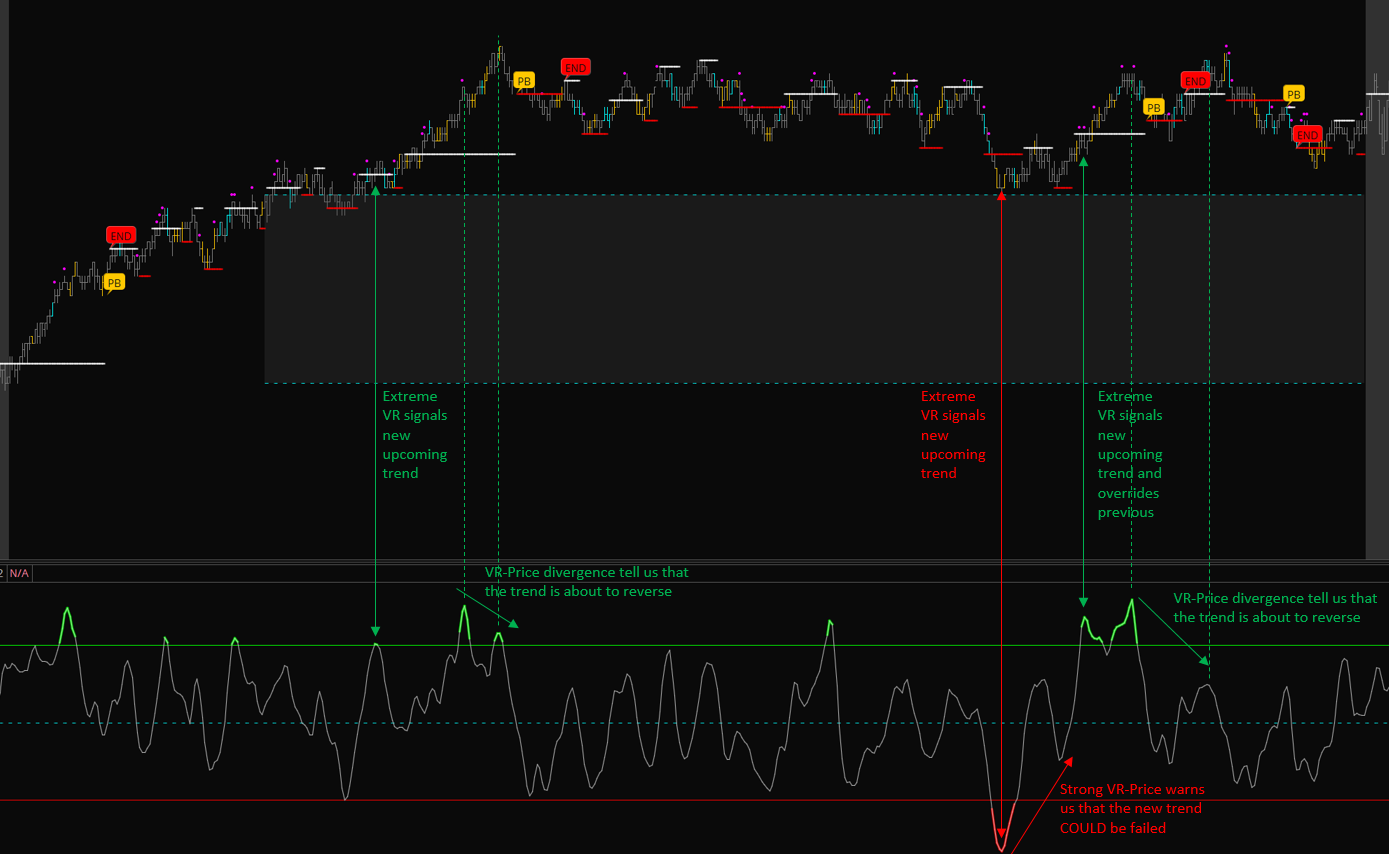
More soon…
