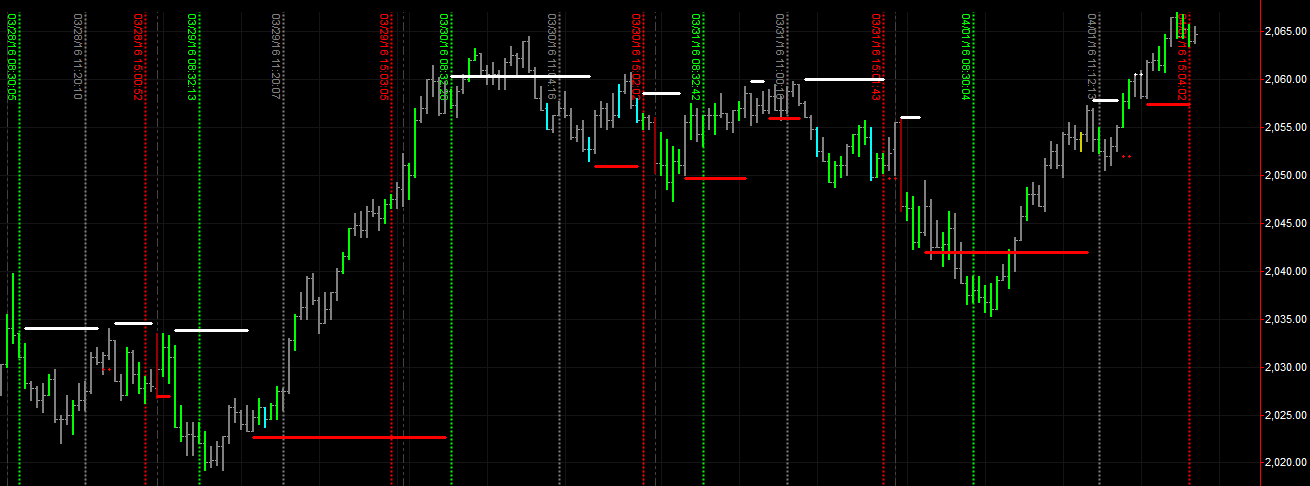
To review the action of the whole week we use a 13,500 ticks chart and reduce the indicators to only XBP Bulls and Bears Support and Resistance (XBP BB SR) , XBP Tape Players and XBP Key Market Times. We recommend to keep this screen always open during your day trading to give you context of the action over the span of the last 15 trading days.
To analyze the action for this week we will split the analysis in two different parts. In the first part we will identify the key levels based on the XBP Bulls and Bears Support and Resistance (XBP BB SR) levels, looking at those price levels where we had the most supports and resistance levels printed. In the second part we will do the same using the XBP Tape Players indicator instead, looking at those levels where we had the highest volume entries (green bars).
Part 1: Week analysis based on XBP BB SR indicator:
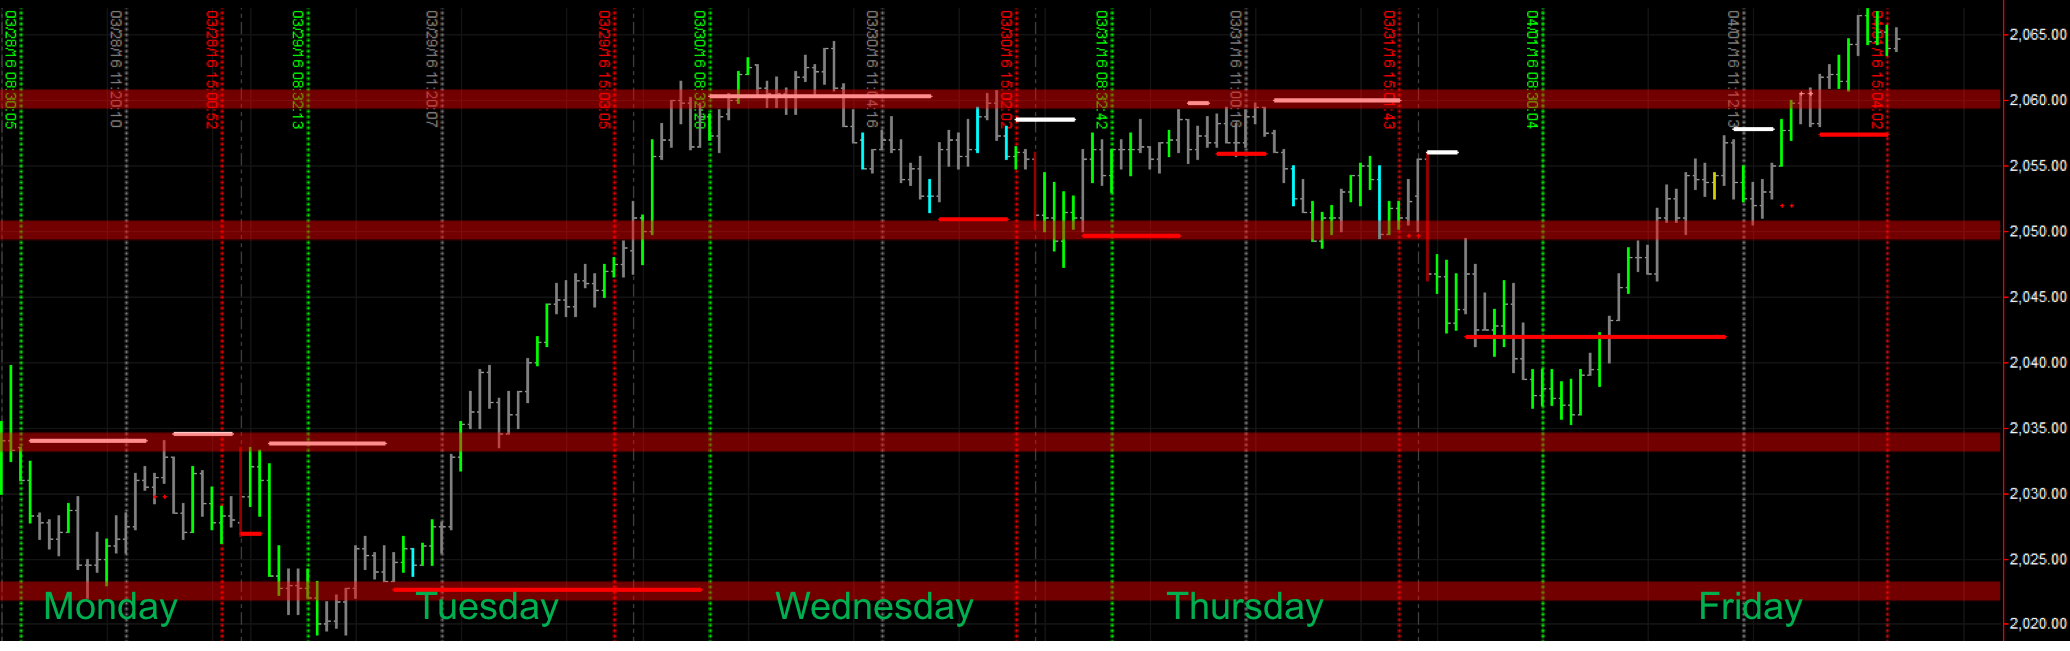
Part 2: Week analysis based on XBP Tape Players indicator:
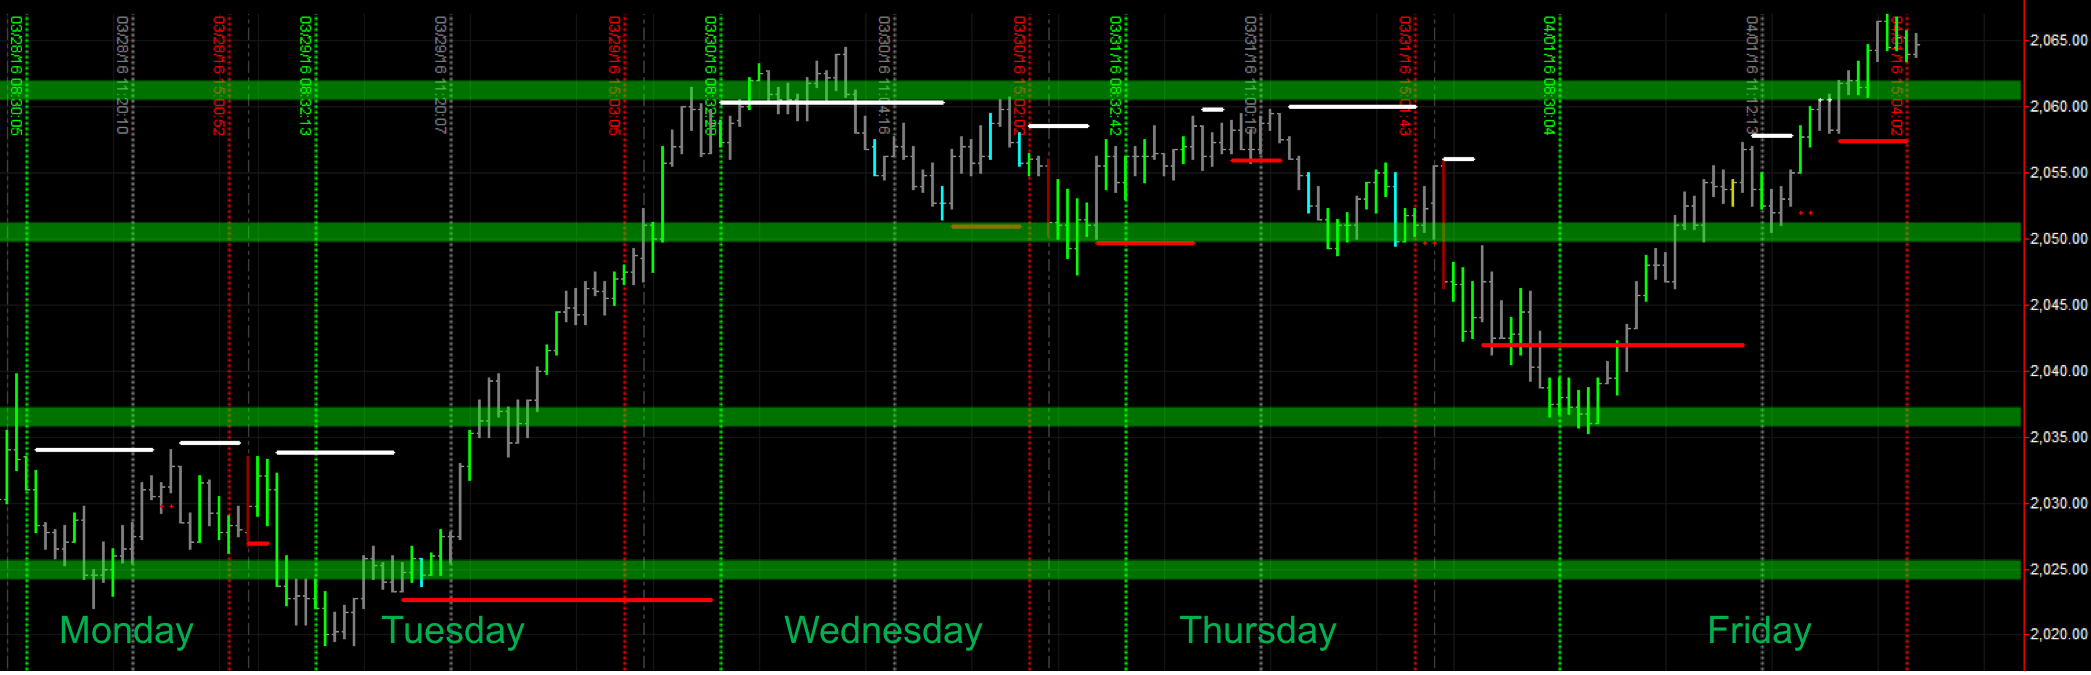
Identifying the levels that are in both charts will give us the key support and resistance levels generated during this week and that we will keep an eye on for next week:
From top to bottom:
- 2060
- 2050
- 2035
- 2025
From these 4 levels, the 2 most important are 2060 and 2035. Both levels have been the strongest support and resistance of the week.
If prive continues above 2060, I will expect 2060 to act as a support at some point during next week whenever the market goes to test this level again. I expect the support to hold due to how strong it was during Wednesday and Thursday as a resistance during this week.
