Review of market action for 27th of January 2016:
- XBP VWAP: Acted as support and resistance level the two times the market approached and crossed it. First from 09:30 to 10:00 and second from 13:10 to 13:40.
- XBP BB SR: Correctly market market tops at 09:00 and 11:00 and bottoms at 10:00 and 14:10
- XBP Tape Speed: Tape action was key to spot the tops and bottoms of the day. The indicator accurately identified the bottom at 09:30, the top at 13:00 and the last bottom at 14:13.
- XBP Market Players: The second tape indicator helped to see how big volume went through day high and open range high level at 10:33, reversed or exited positions at 13:00 and finally exited the market at the bottom at 14:13.
Today has been a day where you can see the power of the combination of the XBP indicators. While they are all non correlated, i.e. analysing different aspects of the market, they align at certain times to signal a key moment in the market. Let’s have a second view based on time:
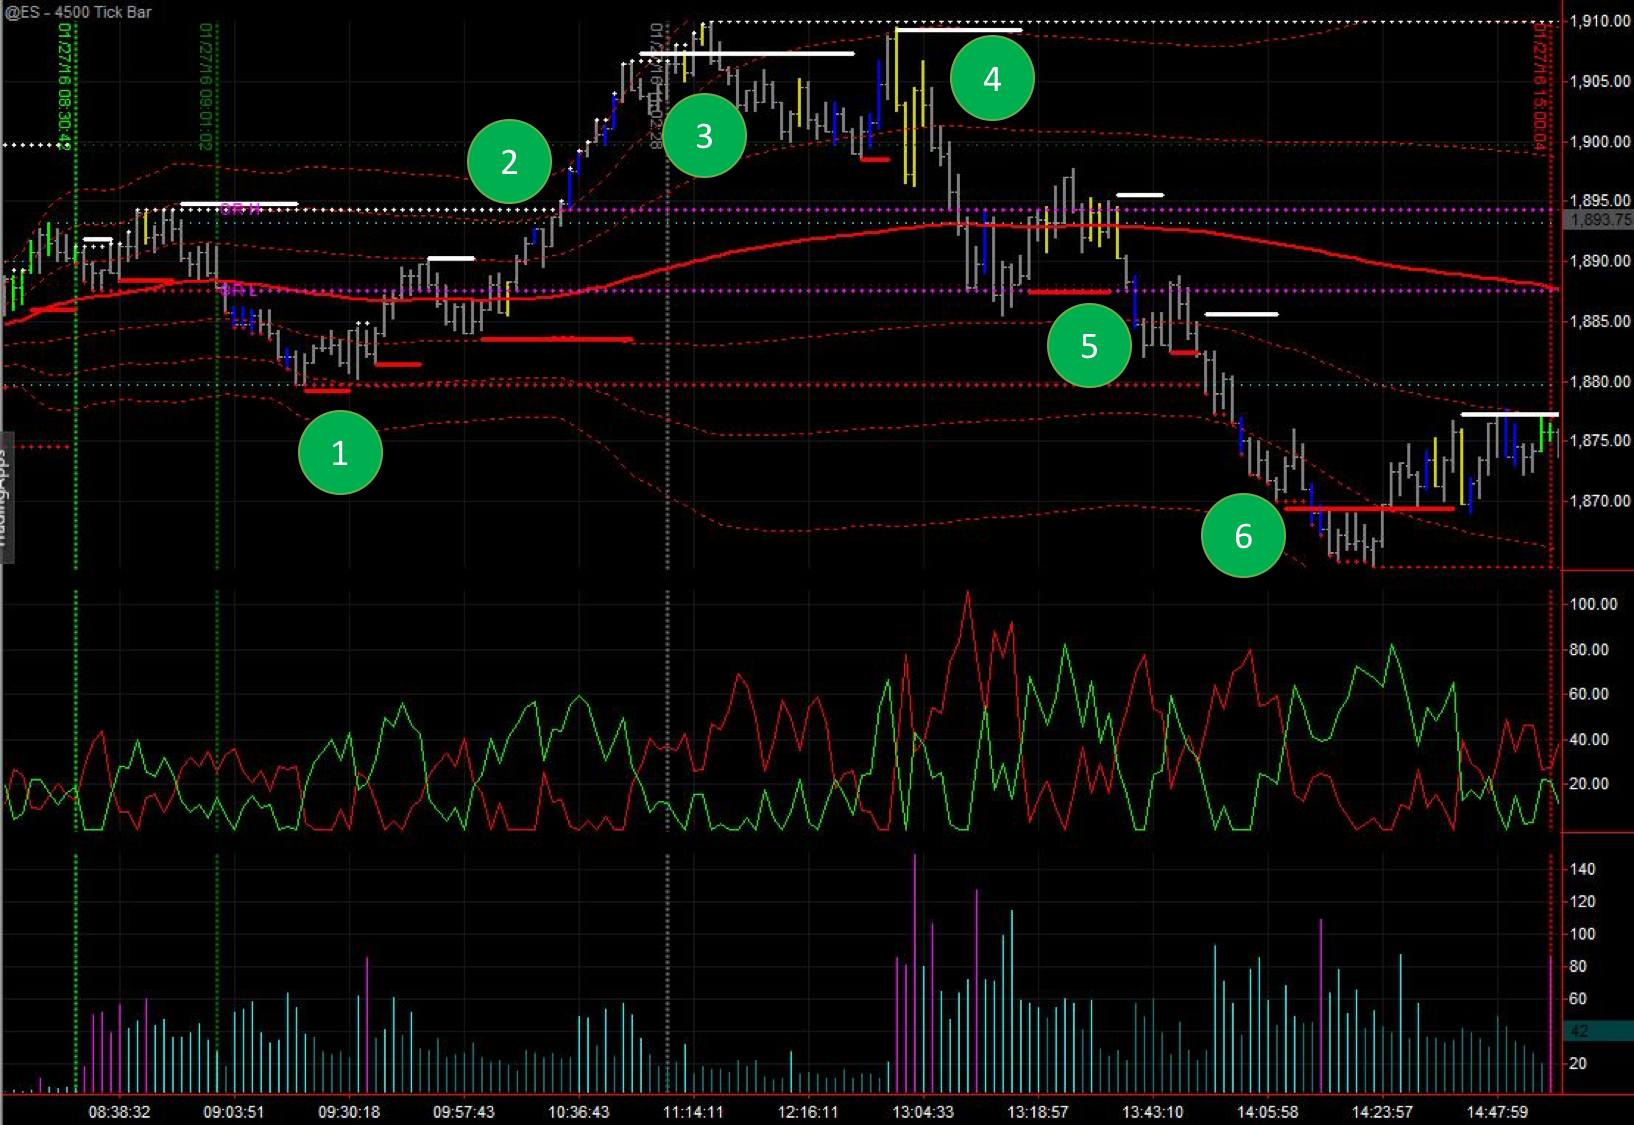
- Tape speed signal combines with BB SR support level and Intraday session low. The market doubts for a while before rallying up, but BB SR indicator identifies well the different supports and resistances.
- The market goes through the key level of day high and open range high with ease running all the stops placed behind the level. The action is clearly signalled with all the blue bars of big volume activity.
- 11:00 o’clock is such an important time. Normally the market has 2 big moves per day, one before 11:00-12:00 and one after. Today a couple of minutes after 11:00 we see yellow bars, which signal very low volume. This signal you shall read it as the price action to go against. Few market players were pushing the market up at this point. Add to that the BB SR resistance level and the market cannot push higher.
- This is the key moment in the market. Blue high volume bars enter on a support, tape speed marks extreme speed and suddenly all dries up and yellow low volume bars appear on a BB SR resistance. This points are difficult to trade if you right at that moment mulling to enter or with an open position. But this is the typical action that you will see time and time again where a new trend will start. Professional players buy/sell the market, making a big move in the market in the opposite direction of their truth intent, and shortly after the volume dries up and the market reverses.
- Good thing about the markets is that normally gives second chances to enter the big moves. Here the same action happens but slower (that’s why there is no tape speed signal) and finally the big volume crosses below the Open Range Low level with a blue bar.
- The end of the move comes at 14:13 with blue bars of high volume combined with a support in BB SR and a big read in tape speed.
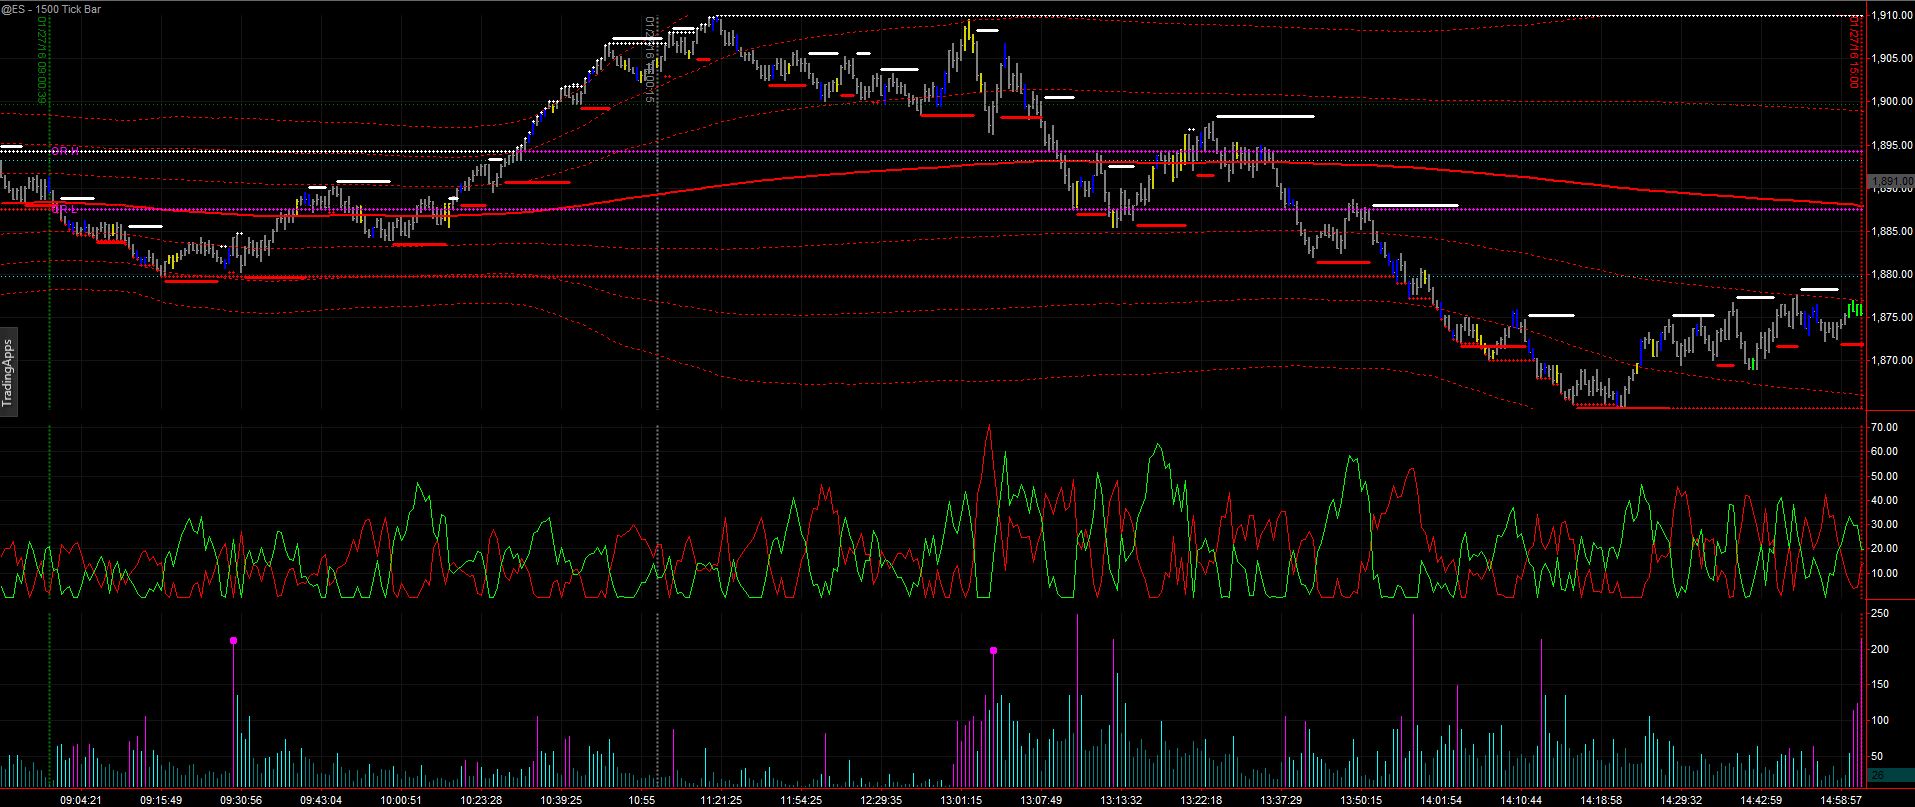
Finally the screenshot of 1,500 ticks for you to identify the same key points but at a lower time frame: