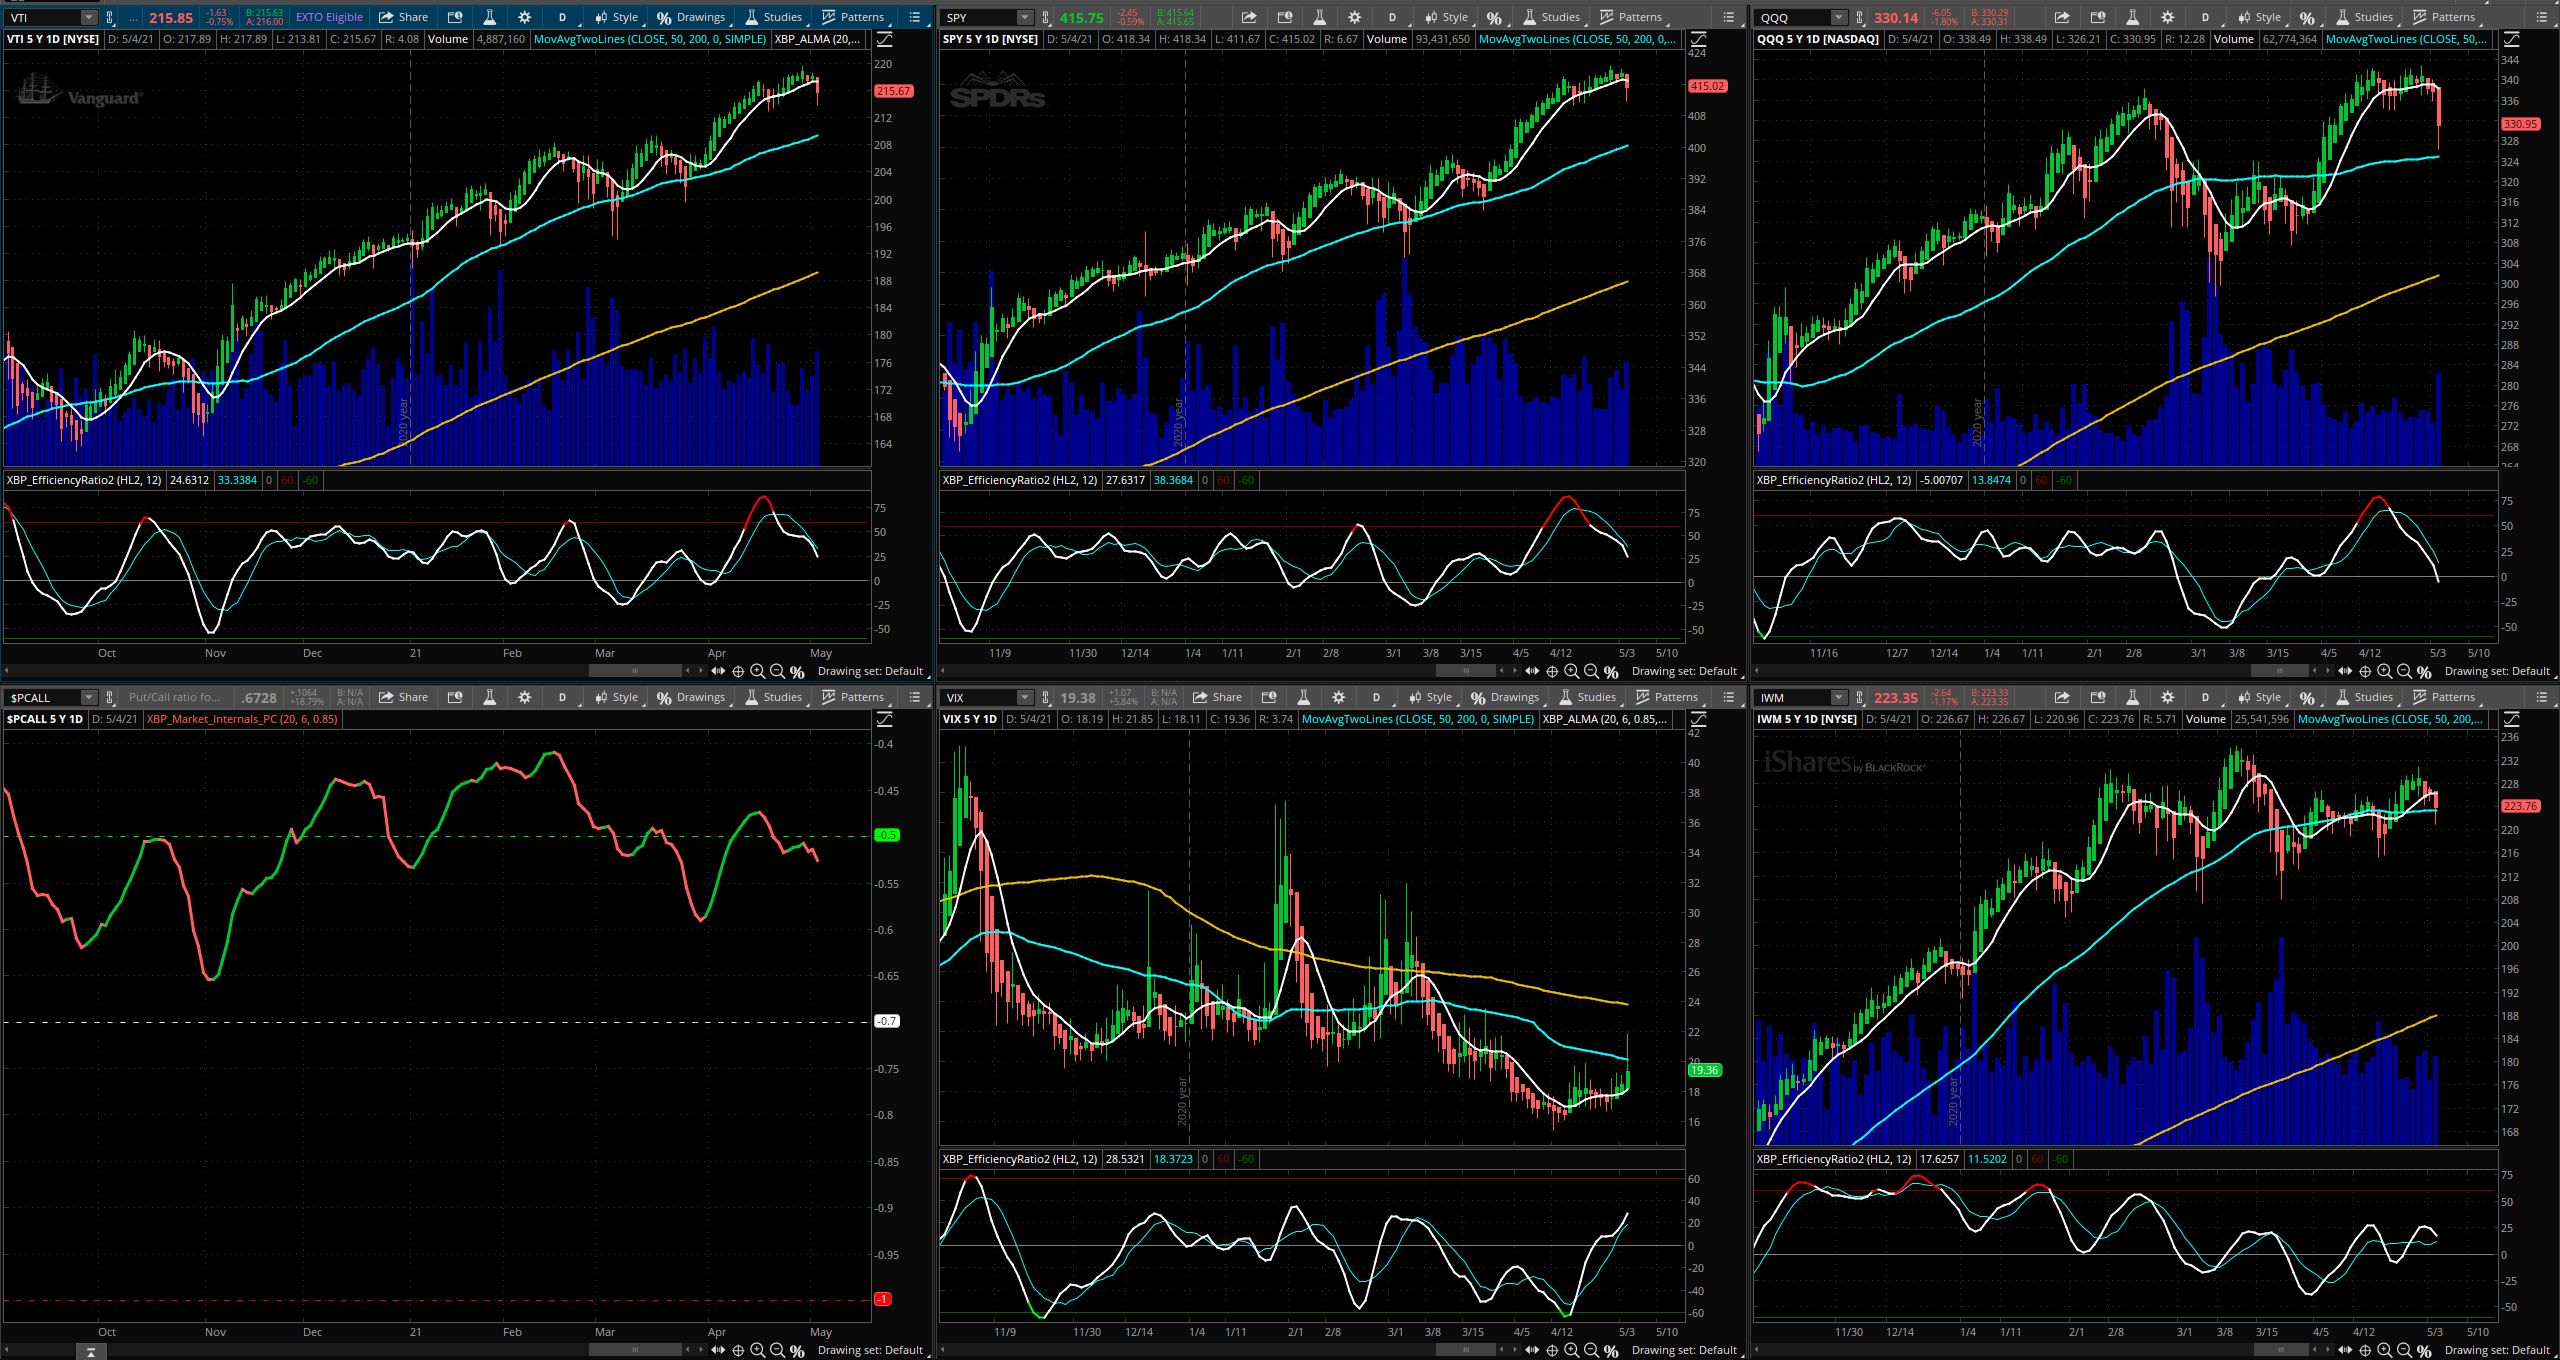
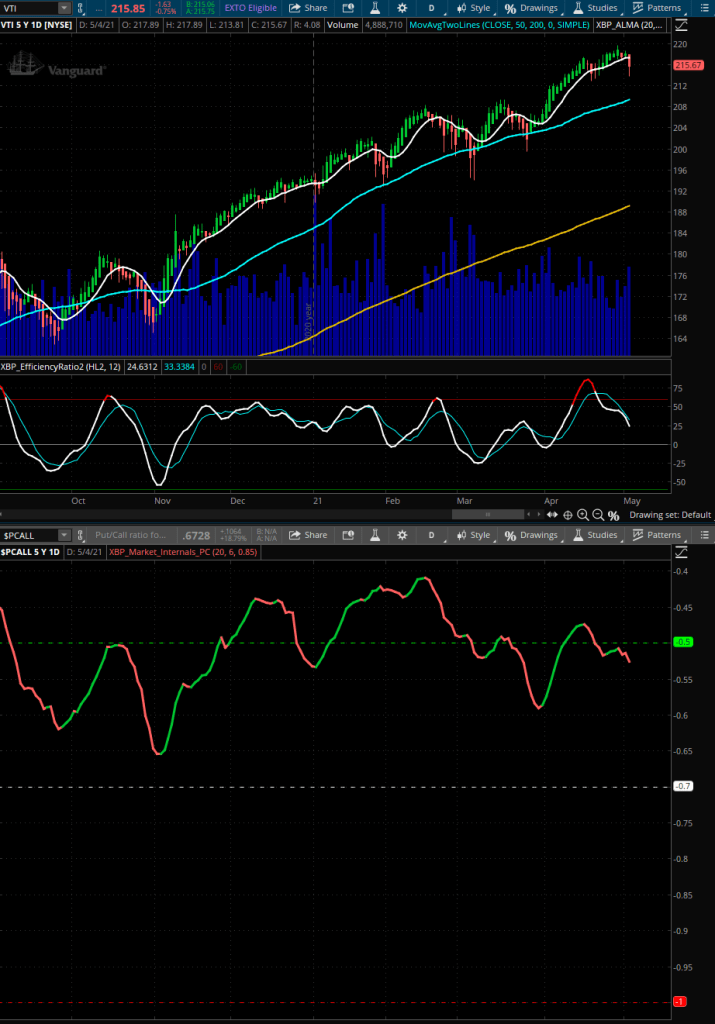
Seems that our predictions from last week are finally happening. The market, which showed already an internal bearish trend in the Put-Call Ratio, has finally post some red days. We can see in the Put-Call Ratio that the values are still high, -0.53 in our adjusted indicator, and we could expect still some bearish action on the days to come. Values near -0.6 or even below (towards -0.7) would be better areas to look for a possible return of the bulls.
The other 4 indicators show no signs of exhaustion on the down side, specially the S&P 500 (SPY) which price action is even far from the MA-50 support level. Both the Nasdaq (QQQ) and the Rusell (IWM) have touched and found support on the MA-50, but we can see that in the recent history this level did not act as a strong support as in the case with the S&P 500:
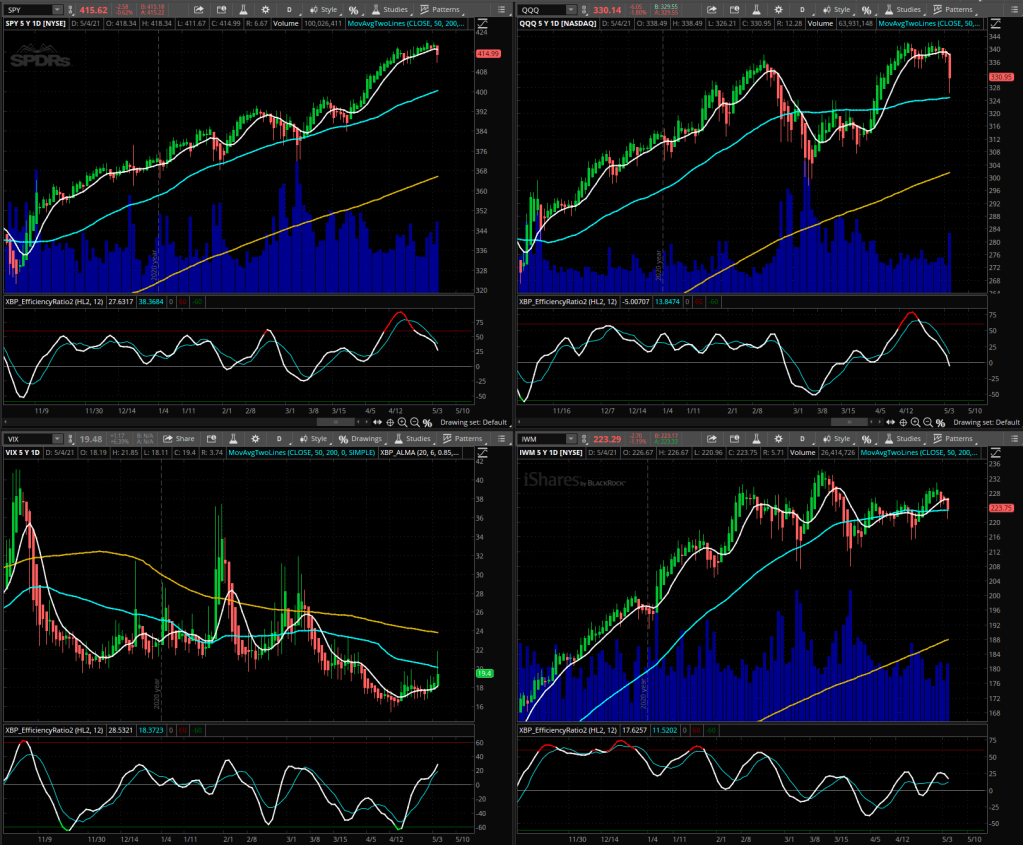
Even the VIX has some room to move higher if we look at the XBP Efficiency Ratio indicator.
All indicates that the current instability could continue. We might have some green days here and there, but I think that until we do not see lower levels in the Put-Call Ratio we cannot expect any return to new highs. Let’s observe and wait.
Getting the XBP Indicators
If you are interested in using the XBP indicators, simply send me an email and we will complete the transaction using PayPal. The price of all indicators for a life-time license is of USD 100 or just 2 E-mini points.
PayPal link: paypal.me/xbptrading
Why there is no a “Buy” button in the site? Well, because I’m not a company. My business is not to sell you indicators but to improve my trading every day. The revenue that I get from these indicators go to fund my online video-game library 🙂
