Leading indicators are those that move ahead of the overall market. There are calculated indicators that use all sort of mathematical formulas (not my favorites) while others rely on market internals and simple ratio or average formulas (my preferred choice). A quite popular indicator of the later is the Put-Call ratio.
The Put-Call ratio is calculated by dividing the number of traded Put options by the number of traded Call options (Puts / Calls). Note that the resulting ratio depends on both numbers, if the number of traded Calls decreases for any reason, while the number of Puts remains the same, the indicator will raise. This raise will not be given by a higher number of Puts traded but by a lower number of Calls traded.
We know that options are traded mainly to profit from a direction in the market. Puts profit from bearish moves, while Calls profit from bullish moves. Then if the ratio increases, more Puts are bought than Calls, this signals an increase in bearish sentiment. On the contrary, if the ratio decreases it is a bullish signal as more Calls are traded.
A Put-Call ratio of 1, where the same number of Puts and Calls are traded is not a sign of a balanced and stable market. Calls are normally more traded than Puts, so there is a consensus that a ratio around 0.7 signals a stable and balanced market. A raising ratio that marches towards 1 (an even exceeds) is considered a bearish signal. A falling ratio that move away from 0.7 towards 0.5 is considered a bullish signal.
We could look at the Put-Call ratio as a oscillator indicator bounded between 0.5 and 1 and, like any oscillator, extreme reads could signal market reversals. Values very near 1 or above 1 are considered by some contrarians as a signal that the market is oversold and that will soon reverse. The same applies on the overbought side when ratio values are near 0.5 or less.
Having an indicator that raises when the market falls and falls when the market raises could be a bit confusing, so I’ve decided to mirror the indicator and apply the ALMA moving average for an easier reading experience:
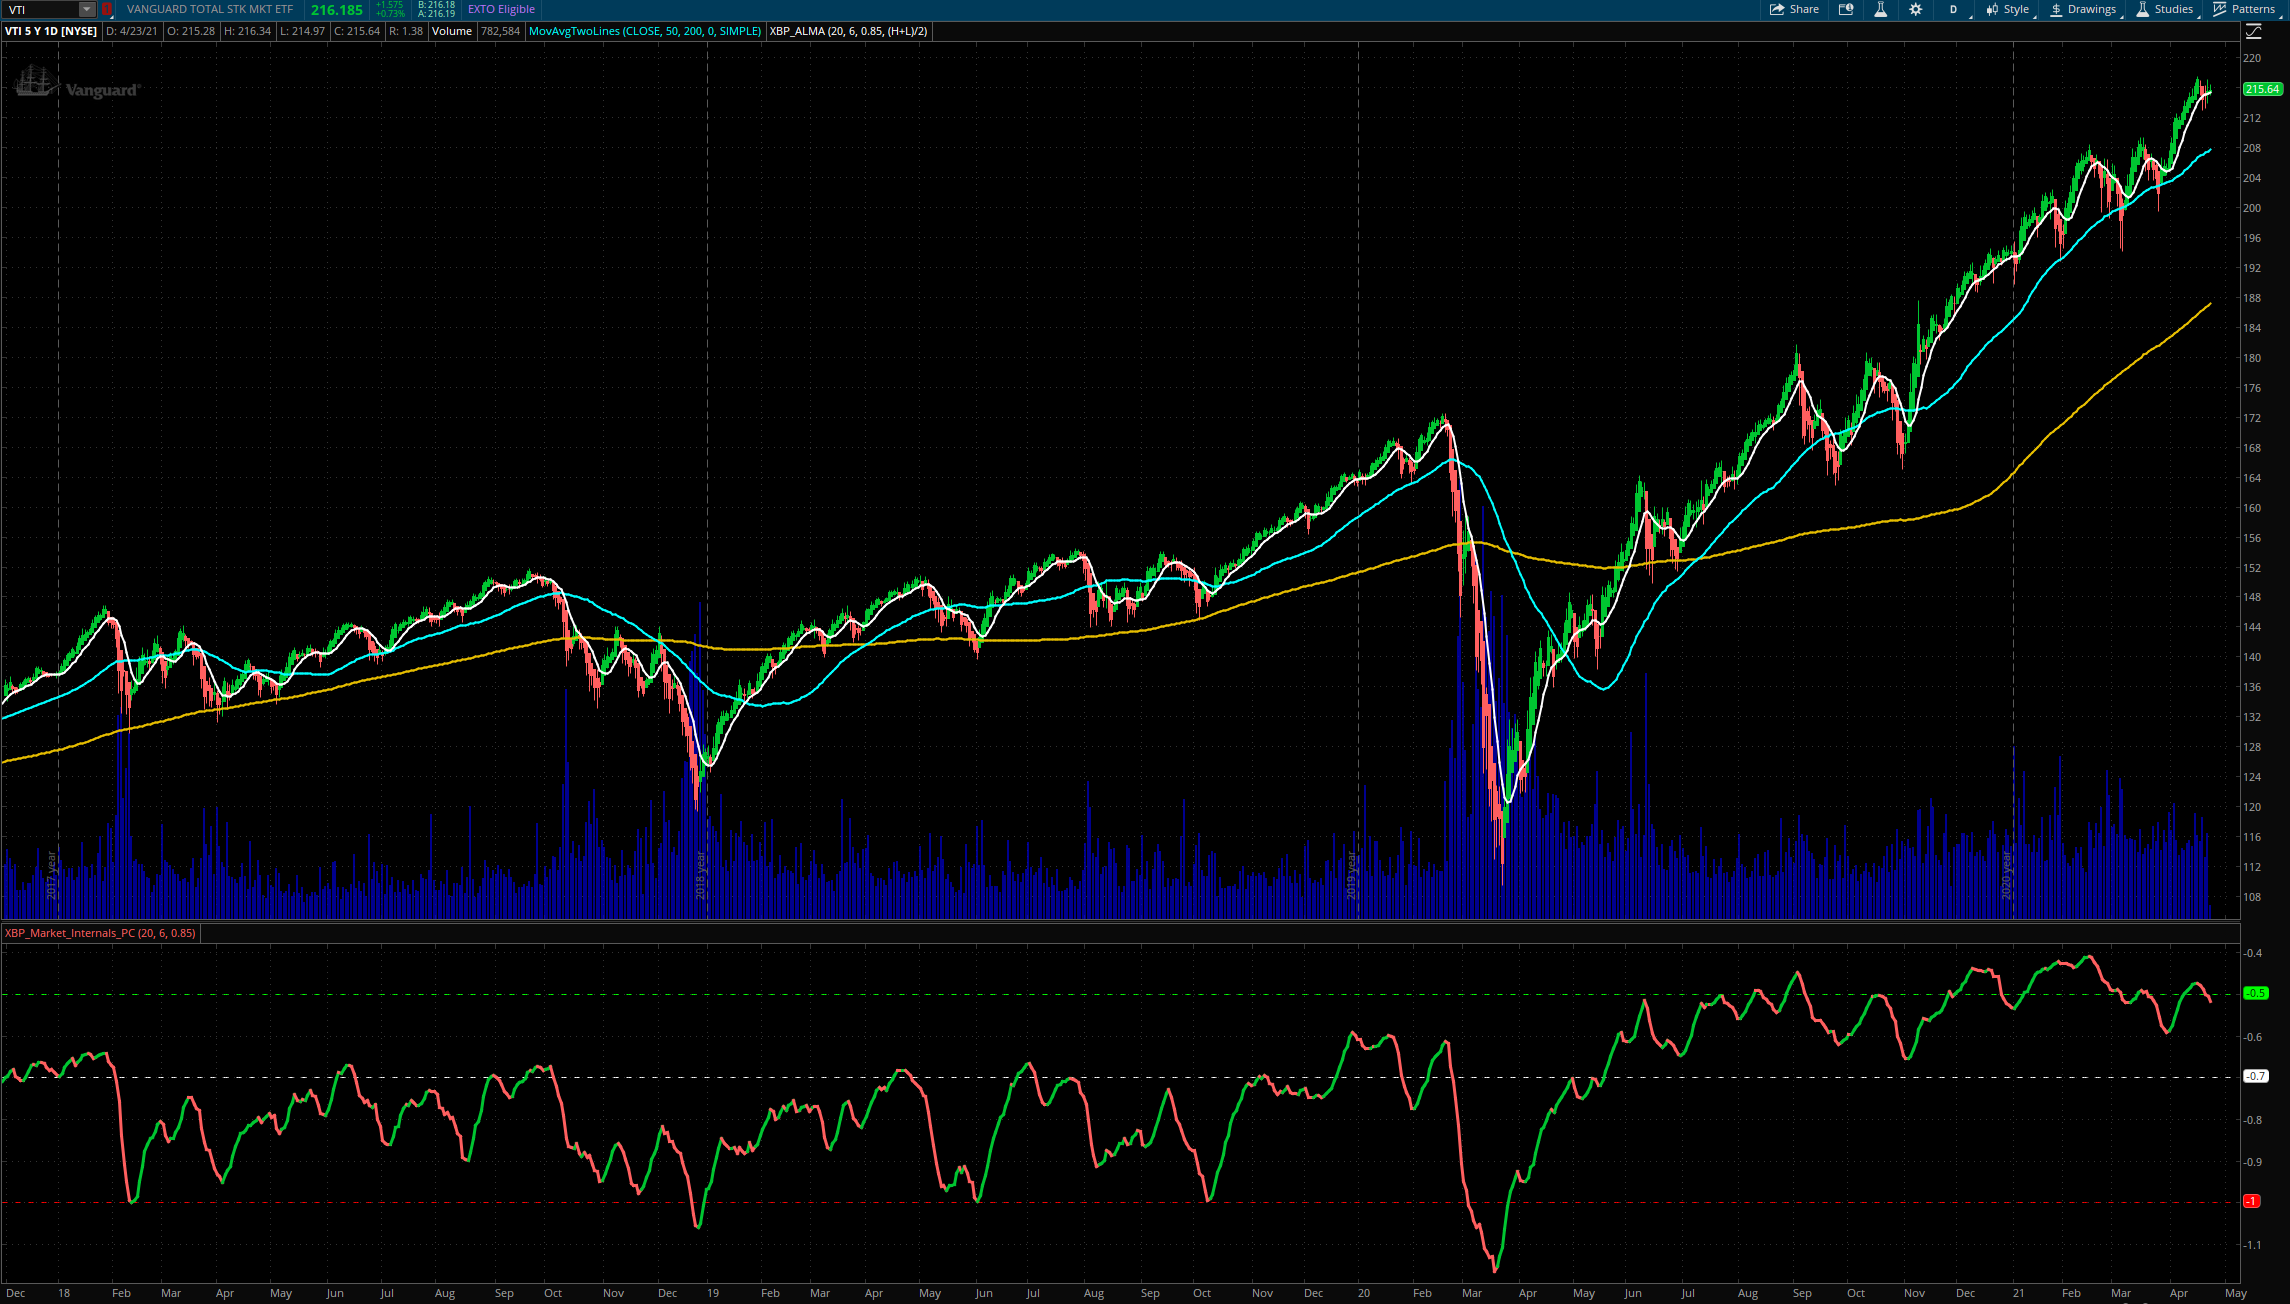
In the screenshot above we can see from December 2017 to today (23rd of April 2021) the VTI symbol (ETF that indexes the whole market) and below the Put-Call ratio indicator smoothed and mirrored.
The VTI chart also has the ALMA moving average (white line) and the 50 SMA and 200 SMA. The Put-Call ratio indicator has three dotted lines for the 0.5, 0.7 and 1 levels (in negative as the whole indicator is mirrored by just multiplying the ratio by -1).
We can clearly see how the Put-Call ratio mimics the overall movement of the market and how reversals at extreme levels match market reversals as well. High probable investment operations can easily be extracted by combining the Put-Call ratio reads with basic price action, for example:
- Long term position: Enter bullish when Put-Call ratio reverses higher when is near -0.9 level and price is above ALMA moving average.
- Mid term position: Same as Long term position but Put-Call reversal occurs near -0.7 level.
As with any indicator, remember that the indicator can signal overbought or oversold levels, or any other kind of signal, but is price the best indicator of all, and you have to hold your position (even if that position is staying out of the market) until price confirms your indicators’ signals.

1 Comment