It has been a long time not doing a detailed intraday e-mini (/ES) review, so today is the day.

The above screenshot is the main intraday screen that I use. On the left panel is a ticks chart where each bar equals to 4181 ticks (Fibonacci number) while on the right panel is a 2 minutes chart. I use the ticks chart to plot computed indicators:
- ALMA moving average with a window of 40 (yellow moving average line)
- ALMA moving average with a window of 20 (white moving average line) + trigger ALMA moving average for buy/sell signals (light blue moving average line)
- Bollinger bands (out-of-the-box ThinkOrSwim indicator)
- XBP Efficiency Ratio (first lower indicator) that calculates extreme oversold and overbought levels.
- XBP Tape Speed (second lower indicator) that calculates the speed in which each tick bar has been completed
I use the 2 minutes chart to plot non-computed indicators. We can understand them as market evidence or direct interpretation indicators:
- XBP Key Levels which plots different significant price levels from the current and the day before intraday action such as: yesterday’s high, low and close; overnight high and low; today’s high and low; and Fibonacci retracement levels.
- XBP TICK which plots the high and the low of the $TICK market internals indicator
- XBP Advance Decline indicator which plots the Advance/Decline All Markets market internal indicator
Both charts share the following indicators:
- XBP Price Bars which turns blue those price bars that have a significant higher volume and yellow those that have a significant lower volume
- XBP Vertical Time Line which plots vertical time lines every 30 minutes and identifies with different colors the opening, the end of the opening session (30 minutes after the opening), noon and close
From today’s session there 3 key moments that we can evaluate:
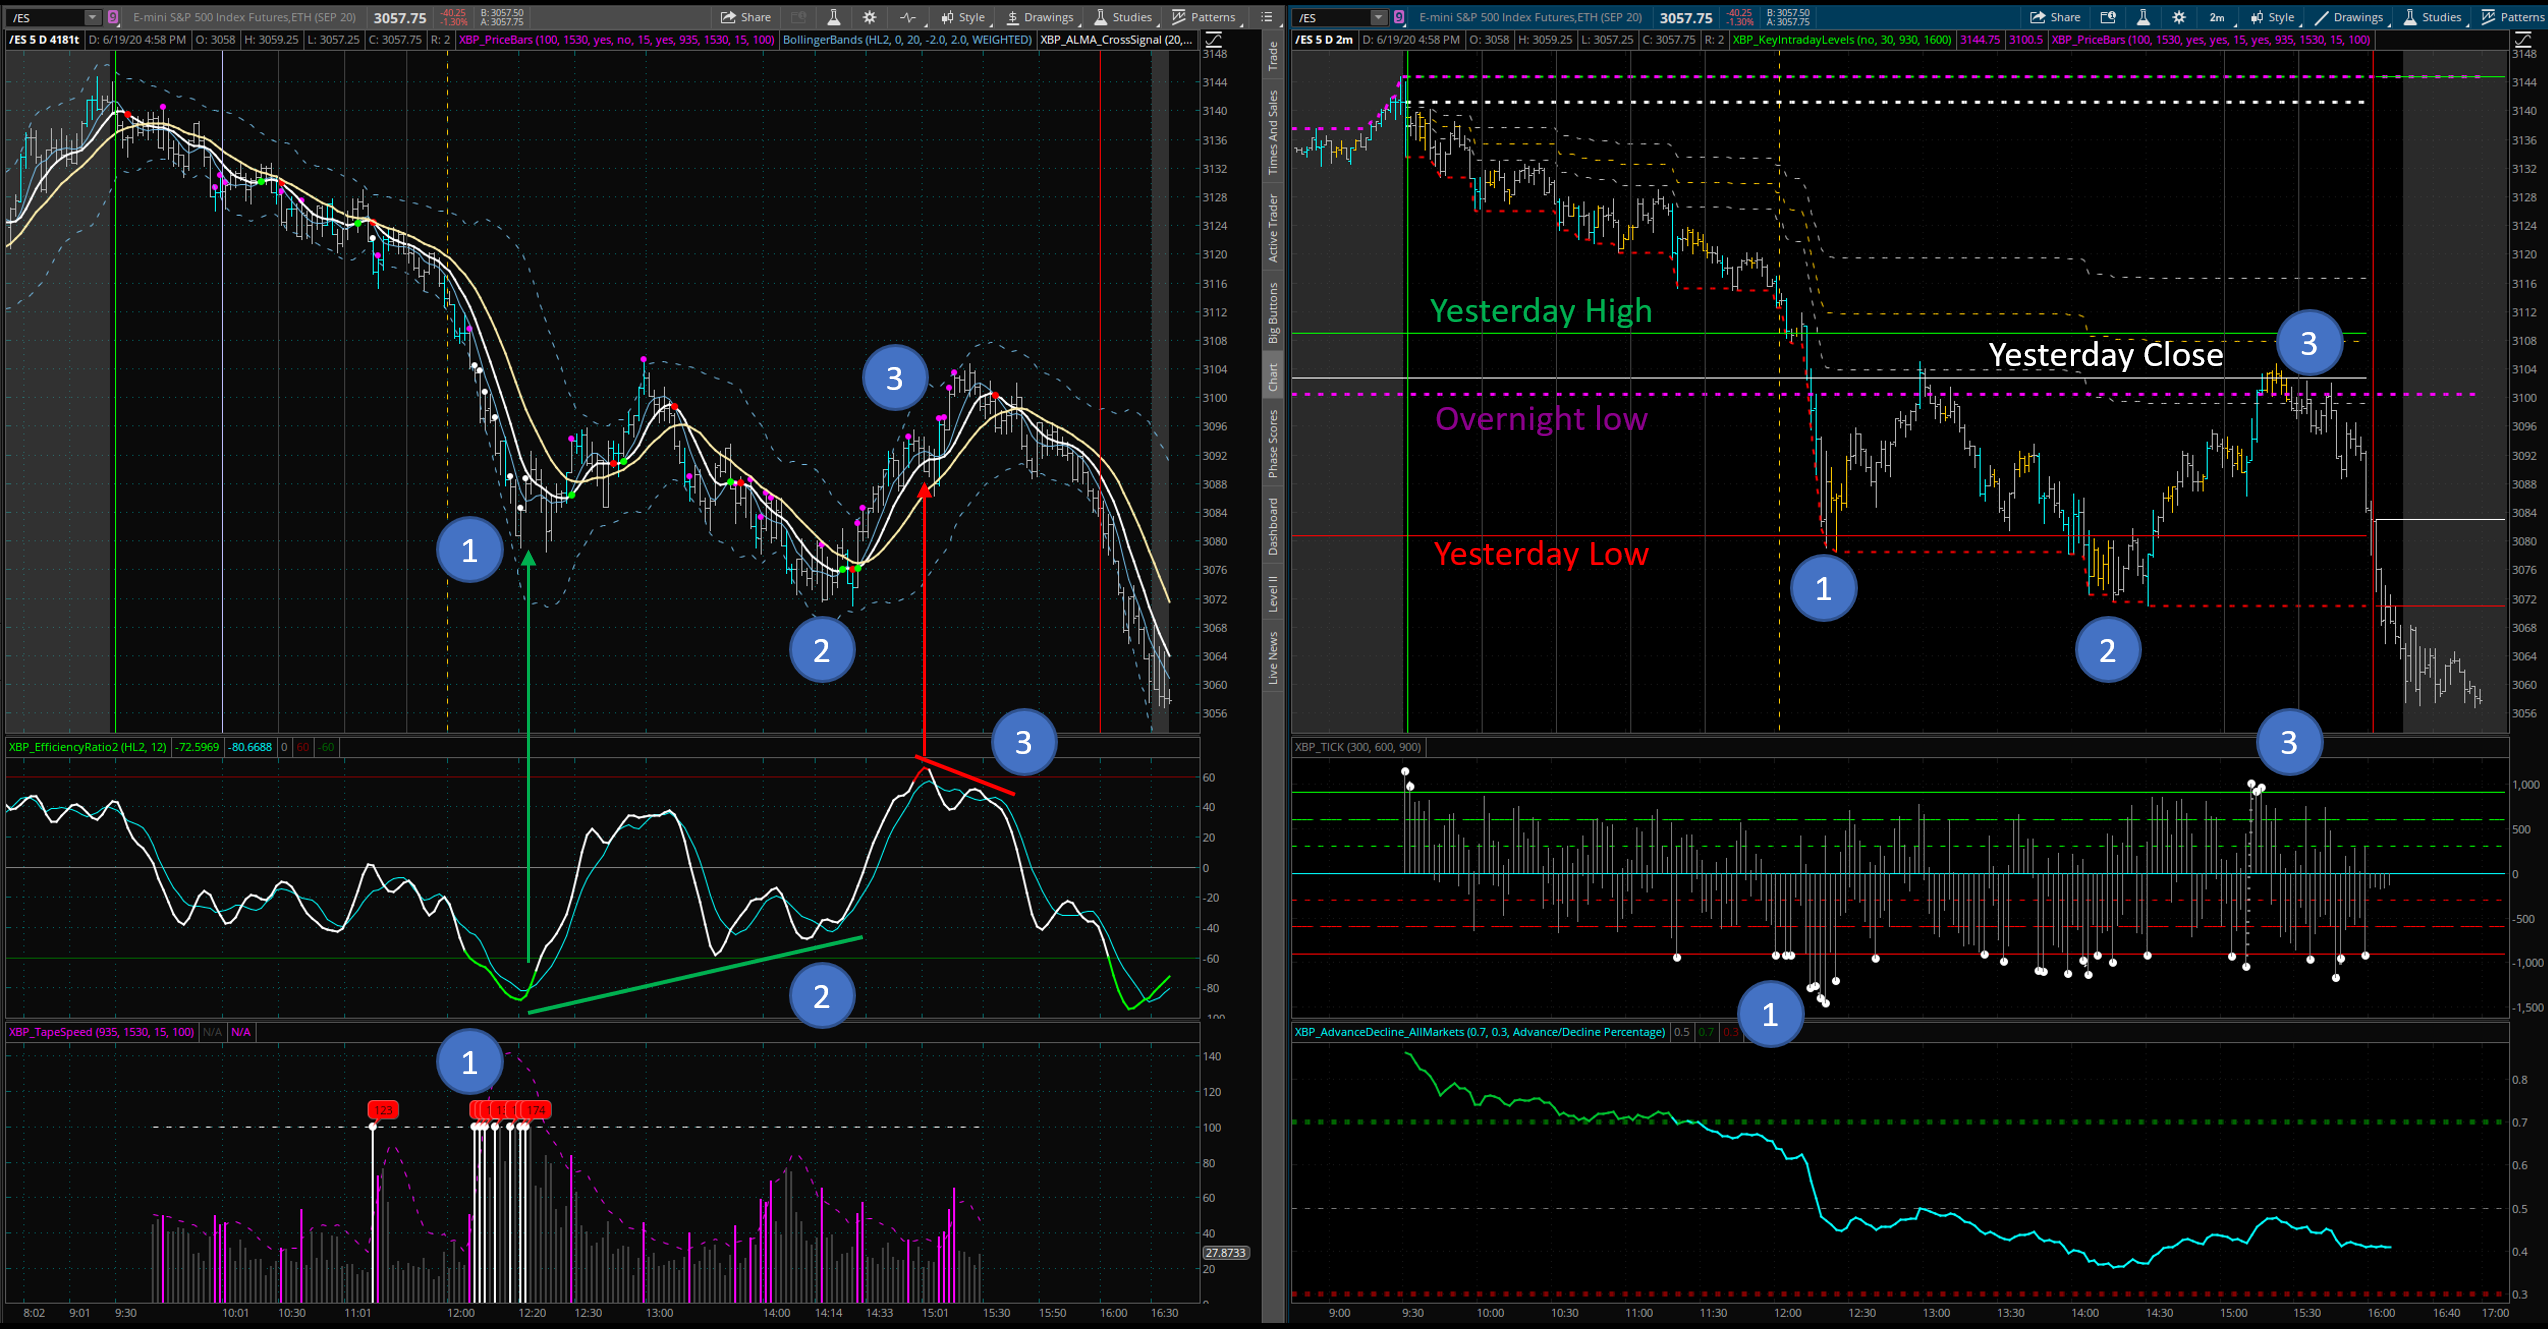
The session starts on a downwards direction coming out of overnight highs and even extremely high readings in the Advance and Decline indicator. At no point the two main ALMA moving averages cross, signaling a price confirmation downwards. The bearish pressure intensifies right after the noon time line and reaches its peak at (1).
(1) At noon time, when price reaches Yesterday’s High level breaks the support level with a lot of energy and breaks as well below the Overnight Low level aiming towards the next resistance at Yesterday’s Low level. We can see bars of high volume and high speed in the ticks chart where the XBP Efficiency Ratio indicator (normally a leading indicator) is already showing oversold readings. Once price reaches the Yesterday’s Low price level we can extreme $TICK reads in the time chart. Also, yellow price bars appear signaling a drop in volume. A pause or a reversal is coming and it is a good point to get out of any short position.
Later, the market bounces and recovers up to the resistance level given by the Overnight Low and Yesterday’s Close. Blue price bars revealing newer volume give us an indication that interest is back. Price cannot break this double resistance and drops back to the previous support level.
Note how during intraday trading is key to detect those price levels that apply gravity force over the price. You can play safe trades if you identify those level.
(2) Once price reaches the previous resistance the key question is if it will bounce out of it or break it. To prepare ourselves for the market reaction (remember to do not anticipate the market move as that would be gambling. React don’t bet.) we can analyze our indicators. XBP Efficiency Ratio is giving a bullish divergence with higher lowers in the indicator while there are lower lows in price. We can see as well extreme negative $TICK readings, leaving little room for more bearish action. Price tries to break below the resistance for around 30 minutes (the longer it tries the lower the probabilities). Finally the bulls win and price bounces from the support level. We can react and enter a high probability long trade once ALMA averages give us buy signals.
(3) The next hot level would be again the previous resistance level. Here we shall not only consider our indicators but also the time of the day. We are approaching the end of the session and on a Friday. The safest thing would be to close our position at the first indication of slowness or any overbought signal. XBP Efficiency Ratio indicator is the first to warn us to close our position at around 3pm.
After this signal we have a bearish divergence reading in XBP Efficiency Ratio plus extreme buy signals in $TICK. This signals the bearish turn that the market will end up doing, but here the trades are of high risk as we are approaching the end of the trading session on a Friday. Better leave the last dollar on the table for someone else.
I hope you see not only the clear benefit that the XBP indicators give you when reading the market action but also how to use them together with non-computed, raw, price indicators. It is said that a lone indicators by itself shall be confirmed by at least another indicator; but if those two indicators are computed indicators you are kind of confirming one interpretation with another interpretation. I think that it is much better to confirm one interpretation with a raw fact coming from the market. Only then, you can have 2 different analysis of the market. If the two, or more, point towards the same direction, then you have significantly lowered the risk of your trades.
Getting the XBP Indicators
If you are interested in using the XBP indicators, simply send me an email and we will complete the transaction using PayPal. The price of all indicators for a life-time license is of USD 100 (just 2 E-mini points).
PayPal link: paypal.me/xbptrading
Why there is no a “Buy” button in the site? Well, because I’m not a company. I’m just a trader. My business is not to sell you an indicator. The $100 is just an appreciation token for all the time that I dedicated to craft the indicators and to write this blog 🙂
