Post related to the market action on December the 12th 2019:
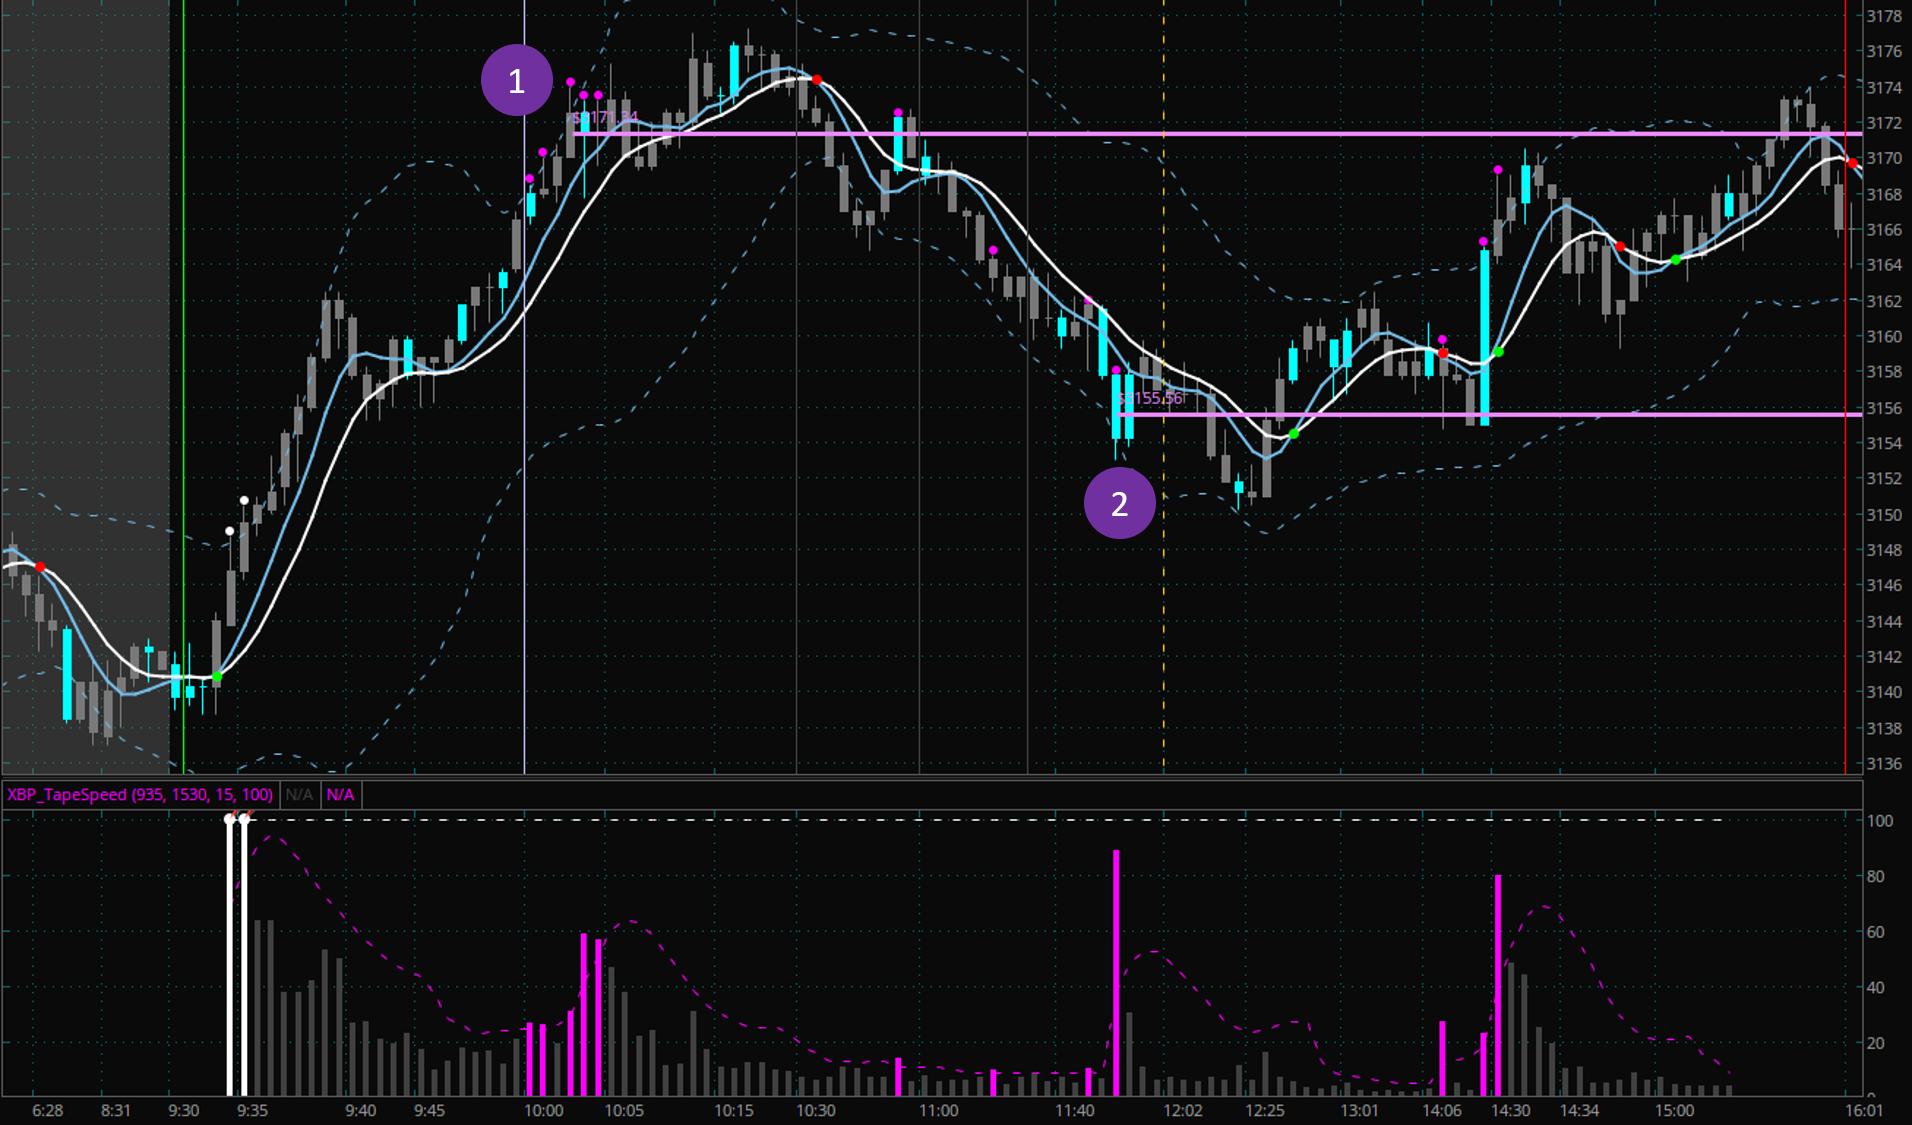
This is the ticks chart with the XBP indicators PriceBars (blue price bars), VerticalTimeLine and TapeSpeed (lower indicator and purple dots on price bars).
When the market prints significant higher tape speed readings (purple bar chart) together with big volume (blue price bars) we can draw price level support/resistance lines. In this case we did this for moments 1 and 2. You can then see how these levels act as important support/resistance levels in the future.
It is clear to see why. When in the market there is a sudden surge of significant activity those levels tend to be defended. In both cases, in 1 and 2, we can spot the same action. The market briefly continues with its trend after these key points but in both cases the market fails to do any significant progress. Then the market reverses showing acceptance of the support/resistance level.

Check 1.1 and 2.1 moments. The market, after a failed key level breakout accepts the failure and reverses curse. But the market is not an easy beast to tame. So it tries again to attack the key levels for a second time:
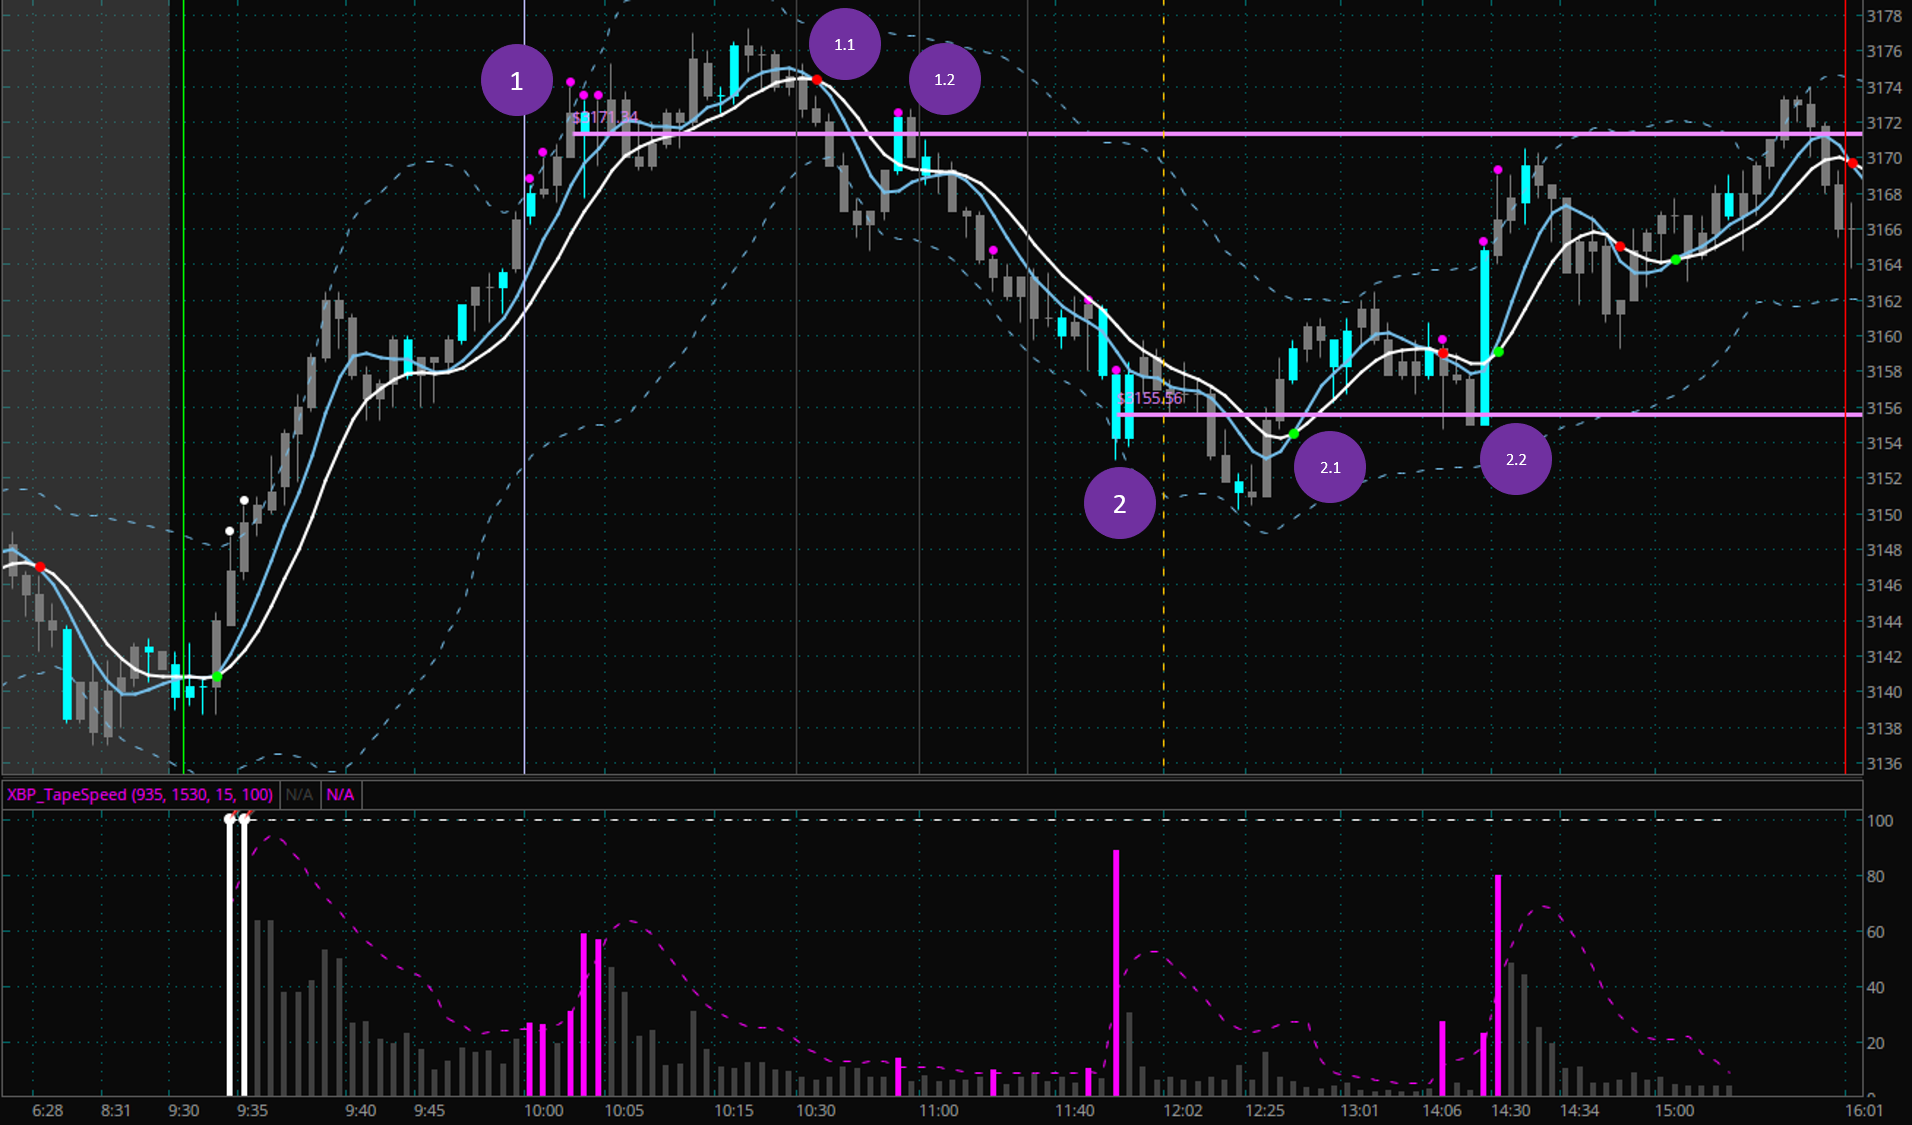
Moments 1.2 and 2.2 indicate these second attempts at breaking the previous key levels, but the combination of high speed tape readings and big volume bars indicate that there was serious activity at those levels. Big players entered those levels and will not let their positions to be overrun that easily. The big players are strong and easily win the battle. The market bounces off the support/resistance levels and trends in the big money direction.
The XBP indicators make it easy to spot the activity of these Big Players by revealing their hidden moves: big size in a short time period.
Getting the XBP Indicators
If you are interested in using the XBP indicators, simply send me an email and we will complete the transaction using PayPal. The price of all indicators for a life-time license is of USD 100 (just 2 E-mini points).
PayPal link: paypal.me/xbptrading
Why there is no a “Buy” button in the site? Well, because I’m not a company. I’m just a trader. My business is not to sell you an indicator. The $100 is just an appreciation token for all the time that I dedicated to craft the indicators and to write this blog 🙂
