Strong day after the Thanksgiving, Black Friday and Cyber Monday break. Plenty of range and trading opportunities.
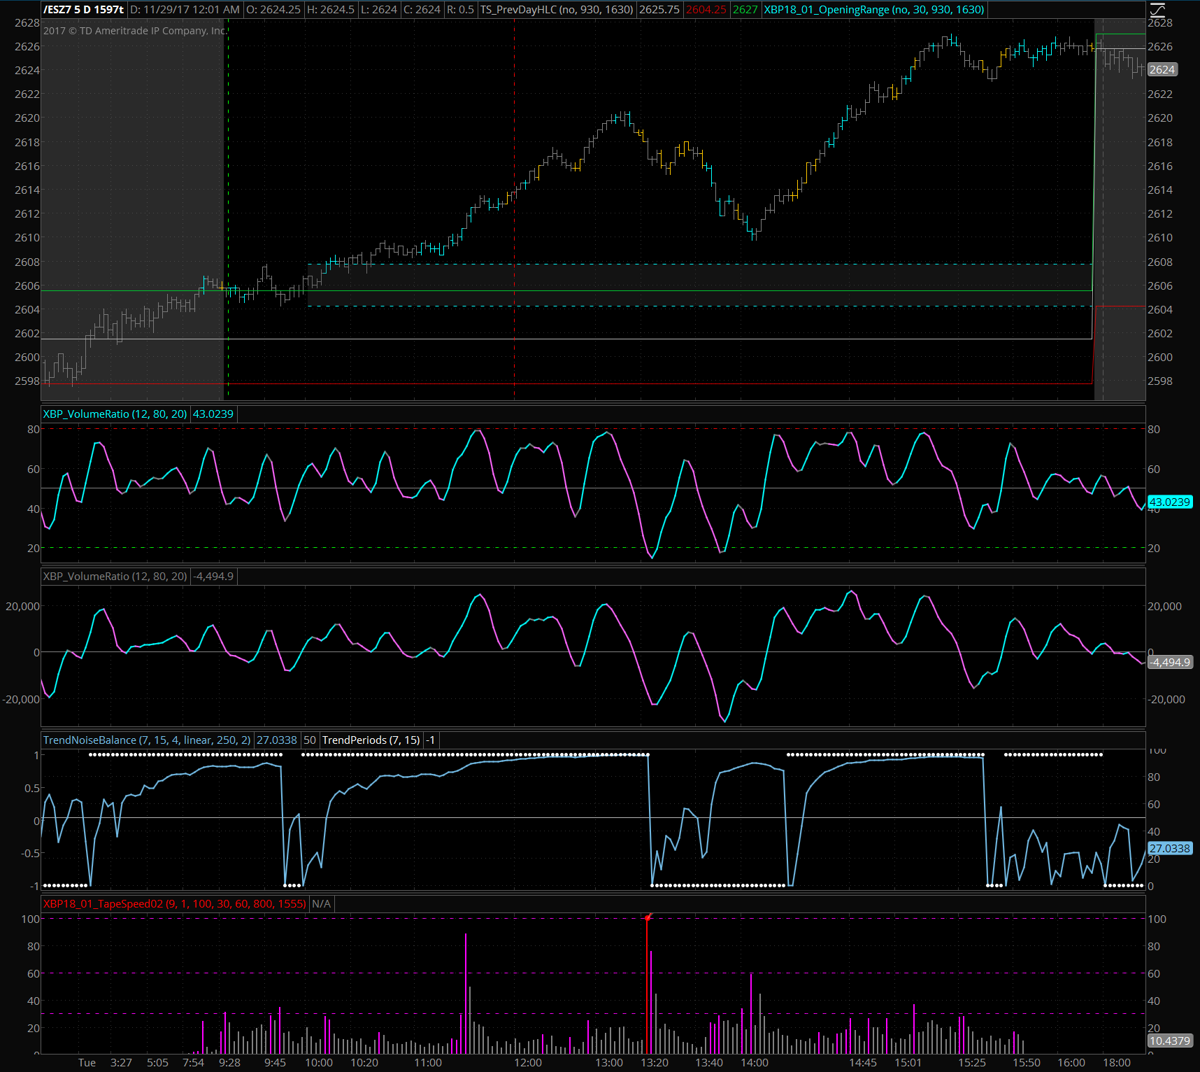
Let’s first see the whole setup that I’m using, which includes the XBP Volume Ratio, the Trend indicators included in ThinkOrSwim, as well as a couple of indicators that I’m working on them and I will have soon released as a bundle, the Tape Speed and the Average Volume painted bars:
The Average Volume paints the bars in 2 colours, blue for higher than average volume and yellow for lower than average volume. The aim with this indicator is to spot the big money entering and exiting the market (blue bars) and those weak moments when volume is not going together with the price action (yellow bars). The special attention shall be given to the blue bars more than to the yellow bars.
The Tape Speed indicator just plots a histogram with the speed that the market reached for each bar. Normally high volume and strong moves start and end in high-speed bars.
Both of these indicators aim to substitute the exercise of reading the tape all the time looking for unusual high volume and high-speed.
You can notice how I combined both Trend indicators, the Trend Noise Balance and the Trend Periods. This is for the economy of space. The Trend Periods is plotted as the white dots. Dots at the top signal bull trend, dots are the bottom signal bear trend. The Trend Noise Balance signals a strong trend is its value is above the level 50 mark.
If you need to read about the XBP Volume Ratio indicator, please read this previous post.
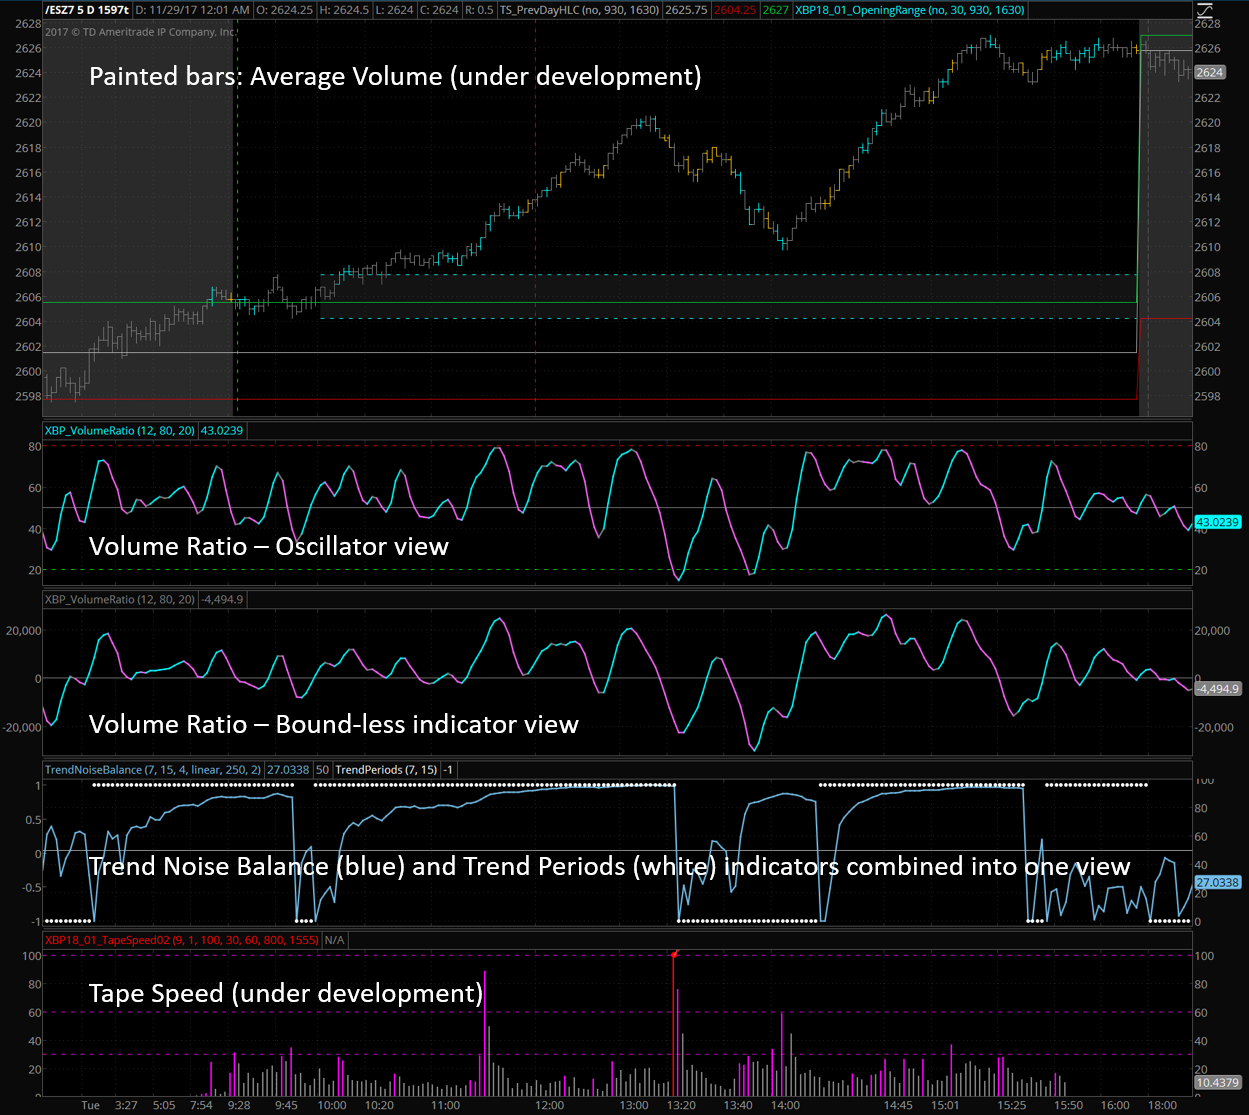
Let’s first identify the weak signals to enter on-going trends at the right moment:
Combining the XBP Volume Ratio with the Trend indicators gave clear and accurate signals to enter the slow bull trend during the morning session.
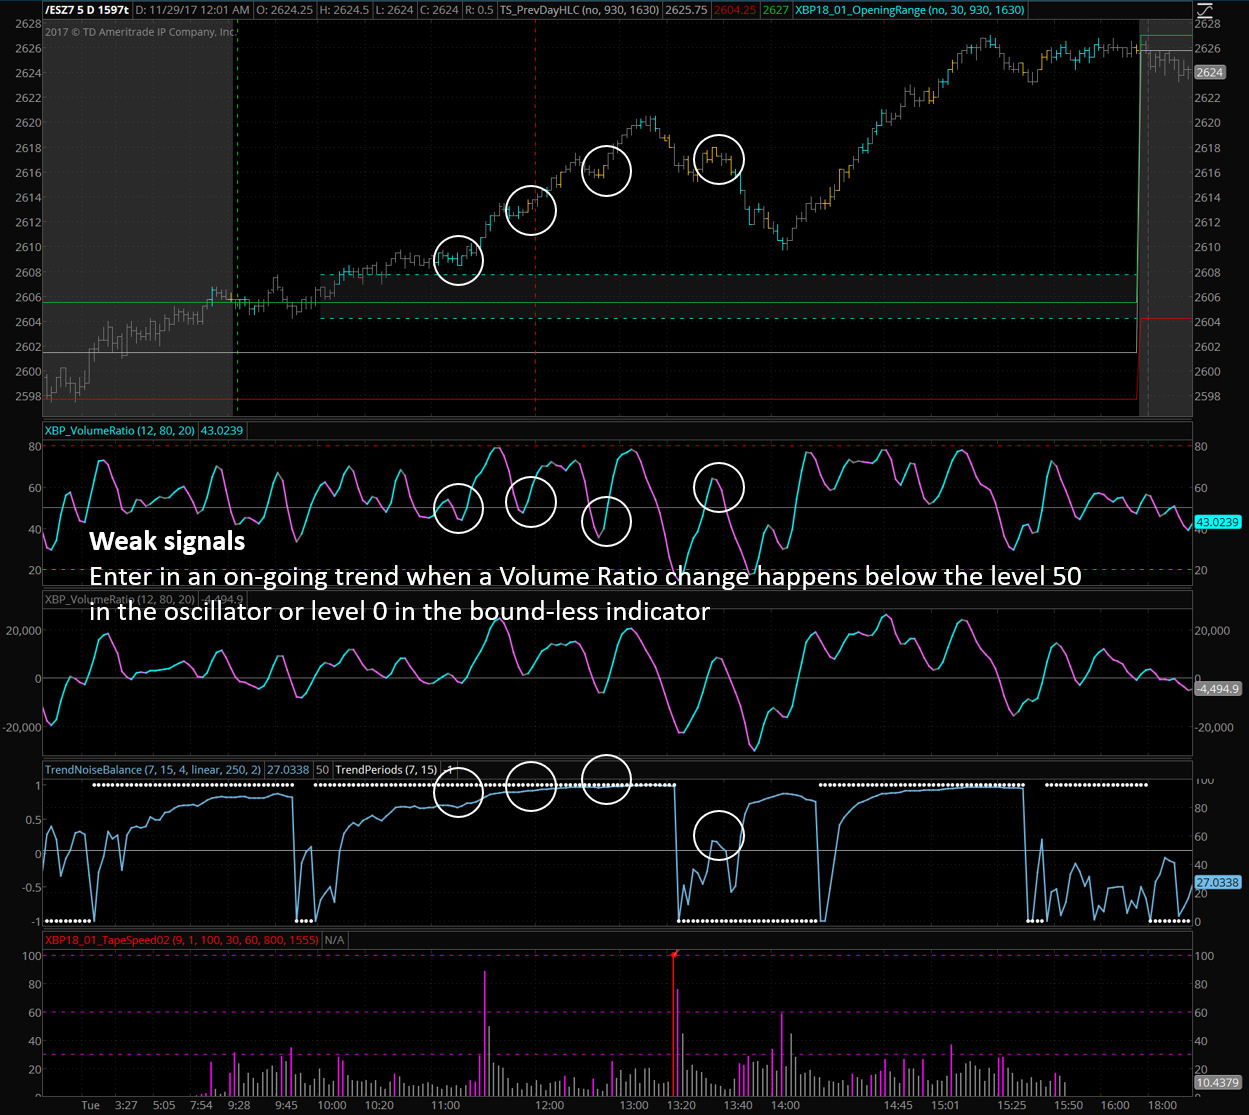
Let’s now see the strong signal seen in XBP Volume Ratio at the trend change around 14:00h:
XBP Volume Ratio is clearly showing a bull divergence with price. We then shall wait for the Trend indicators to confirm the trend change to bull to enter a high probability trade. We can stay in trade until we see either a divergence in XBP Volume Ratio, which can be seen at around 14:55h at level 2622 or even extend the trade until the Trend indicators change the trend.
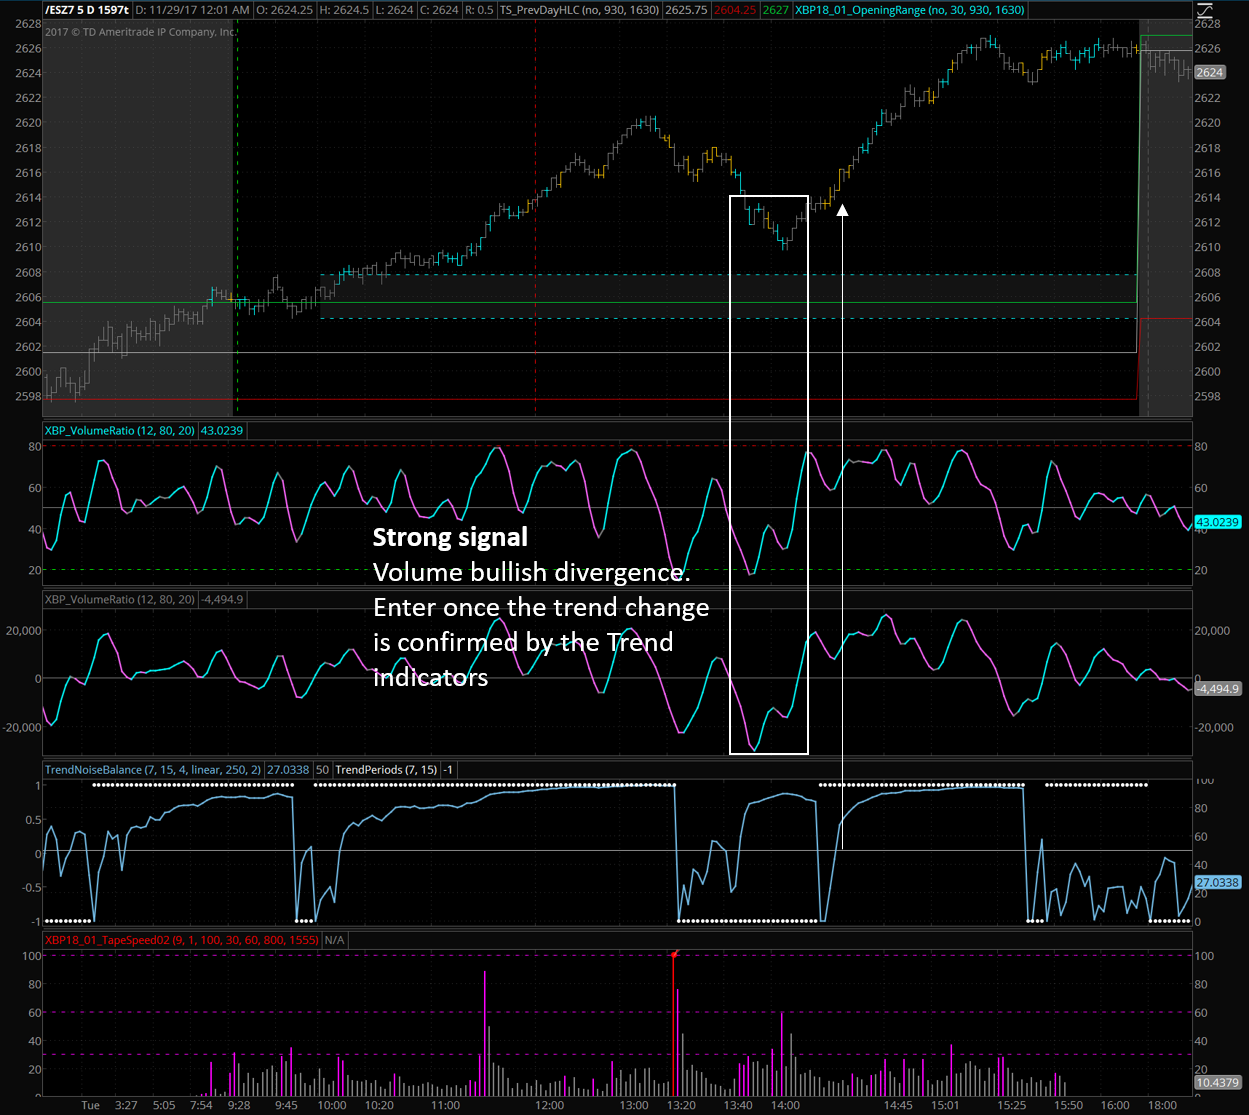
Let share with you a clean screenshot so you can practice to spot good entry and exit signals by your own: