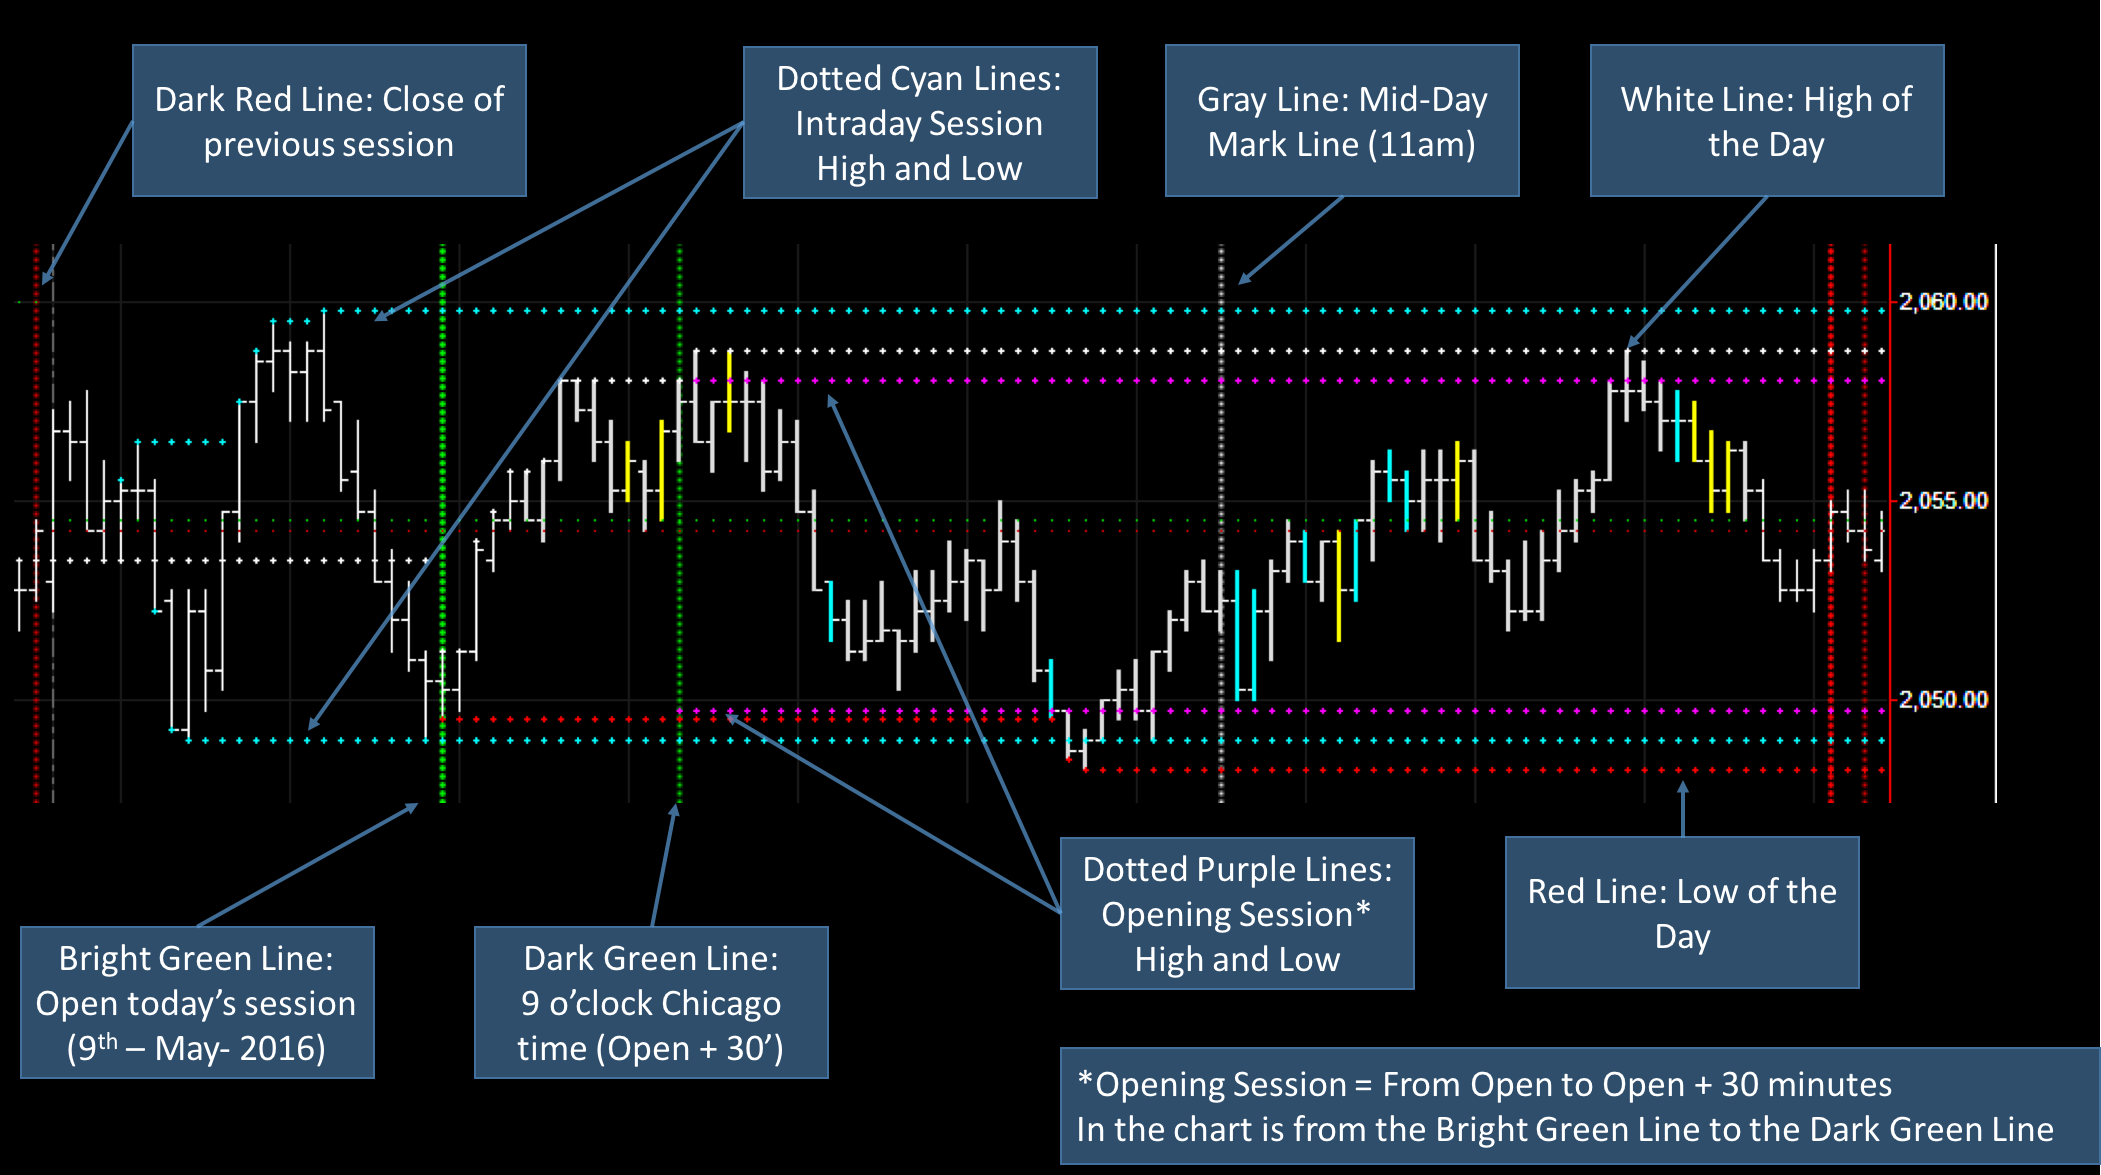
The screenshot in this post is for the session on the 9th of May 2016 for the ES futures contract seen in a 4,500 ticks bar chart. The XBP Market Key Levels indicator automatically plots the key levels for the session, so you don’t need to memorize or draw manually levels like the High and the Low of the day, yesterday close, etc. The XBP Market Key Times indicator, plots vertical lines at key times, like the open, 9am, 11am and the close of the session.
On today’s session (9th of May 2016) the combination of these two indicators have revealed an interesting pattern. Price have moved only between the Opening Session High and Low, which are plotted using two dotted purple lines and marked with the accronymous ORH and ORL (Open Range High and Open Range Low).
This behaviour, though, is not unique of today’s session. You will see plenty of occassions where these ORH and ORL level act as support/resistance levels. Unfortunatelly I have no explanation for this behaviour, but I reached this conclusion based on direct observation.
Regardless of the technical reason, having an indicator that plots those levels automatically is a must have.
