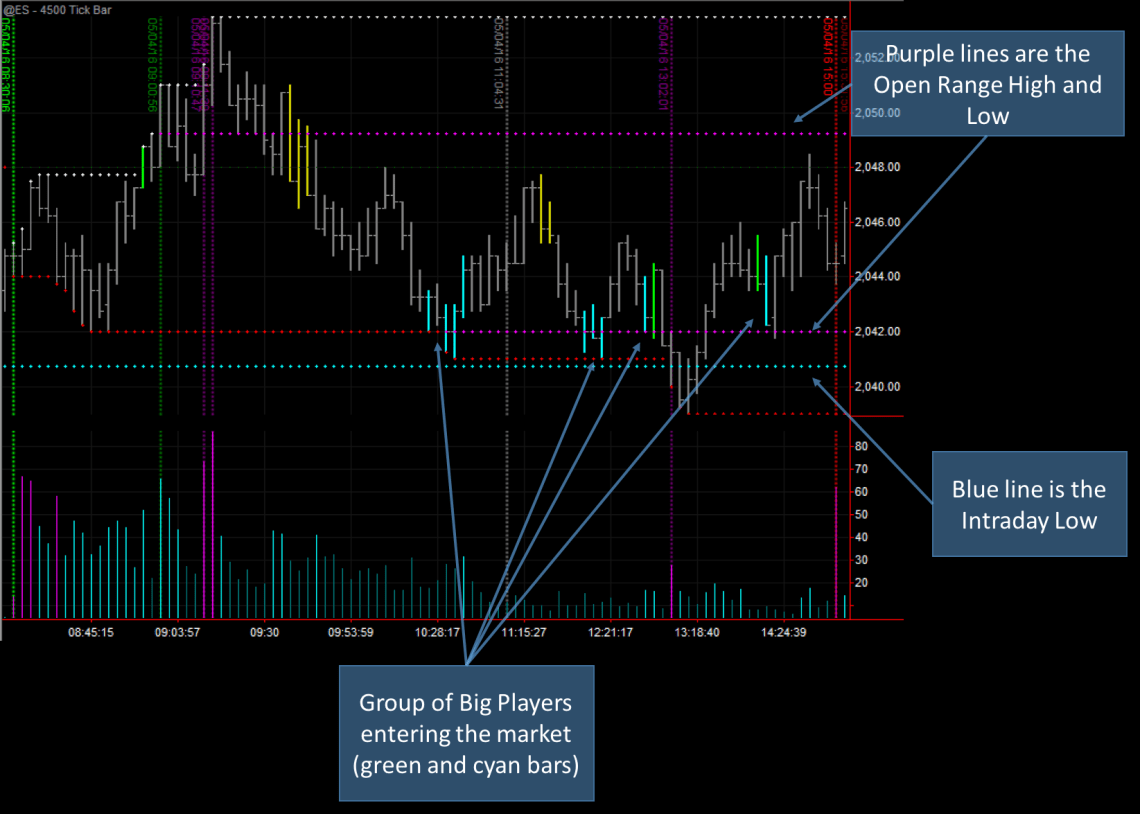
Clear action of Big Players entering the market at the lows and finding good value to buy the market.
The XBP Tape Players indicator paints the price bars depending on the relative average volume that occurs on that bar. Blue and green bars signal abnormally high volume, while yellow bars are for abnormally low volume.
The XBP Key Market Levels indicator autoplots for us the key levels of the Opening Range High and Low and Intraday session High and Low.
As seen in the attached screenshot, big volume entered at the key level of open range low and Intraday low. Whenever you see big volume entering at a key price level it will mark a key point in the market.
Due to this action, I will keep an eye on this level (2042-2040) and expect it to act as a support in the first time the market test this level back again. As per tomorrow I expect the market to go up away from this level. We will see… 🙂
