Grinding horizontal day, until the last part of the day that the market finally decided to go up. But could you have seen this action before it? Yes, with the XBP Indicators:
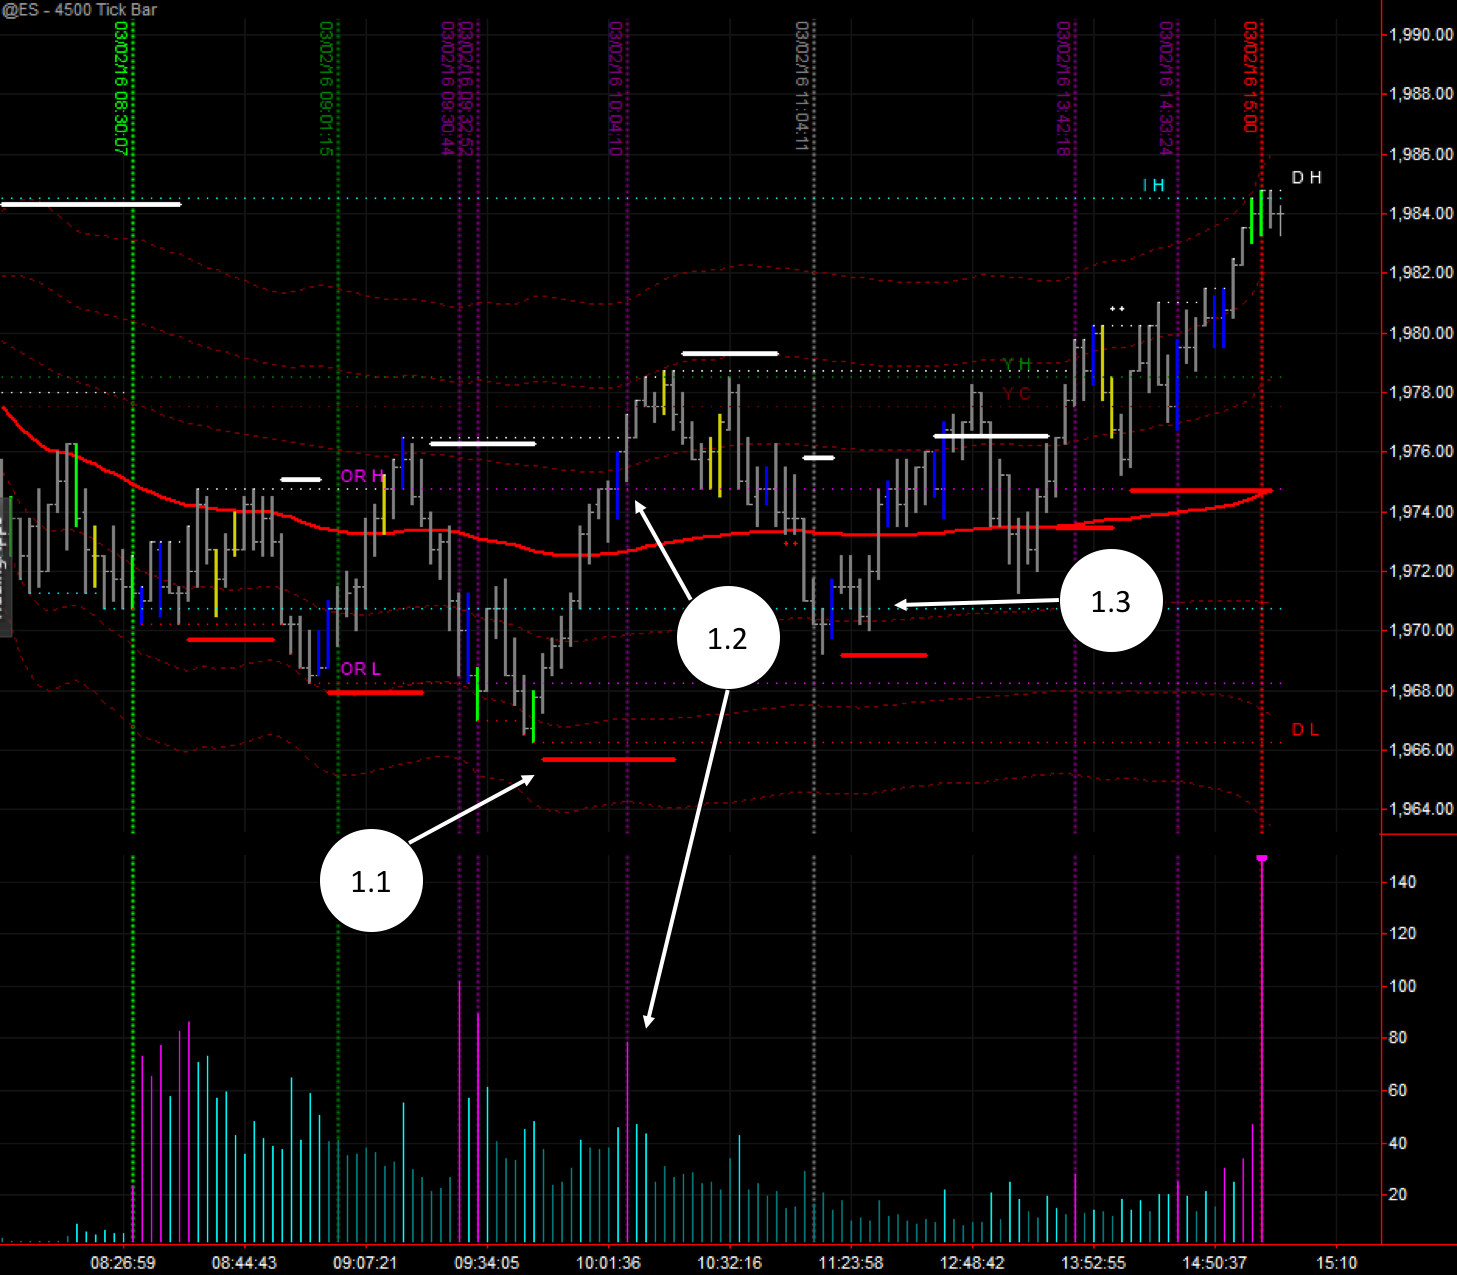
(1.1) With the release of the Oil news the market dropped 1967-66 level and bottomed minutes before 9:45am. Here we can see the heavy volume entering the market (green bars in the XBP Tape Players indicator) right at the bottom. This is a typical indication of Big Money entering the market.
The XBP BB SR Indicator marks a support (red horizontal bar) revealing to us that this is indeed a support level. Adding together these two clues we can certainly say that price will bounce up, and trade accordingly to profit from it.
The key trade to take here would have been to go Long until hit the stops of the Small Money (retail traders) whom shall have placed the stops behind the “safe wall” of the VWAP (for sure there is a Fib level around there somehow… I’m not a believer of Fib levels…).
(1.2) Here is the moment where all those Small Money stops are hit. You can see a sudden acceleration in the tape (bottom purple bar) and a big volume blue bar, indicating that lots of transactions are happening at that very same moment.
(1.3) Right after (1.2), the market could trespass the 1980 level, marked with a resistance by the XBP BB SR Indicator (white horizontal bar). Faced with this lack of upwards force the market drop until the previous area of support near the 1970 level. Here you can see again Big Money (blue bar) entering the market on a support (red horizontal line) and from here the market went to close on the highs.
Difficult action day with lots of U-turns, but thanks to the clear signs of XBP BB SR Indicator and the clues by the Tape Indicators (XBP Tape Speed and XBP Tape Players) you could have traded generating a good profit today as the market moved in a wide enough range.
