What a rally! In 4 trading days we are 100 points up in e-mini futures. But is the rally over? Let’s analyze the market using our volume and tape based indicators.
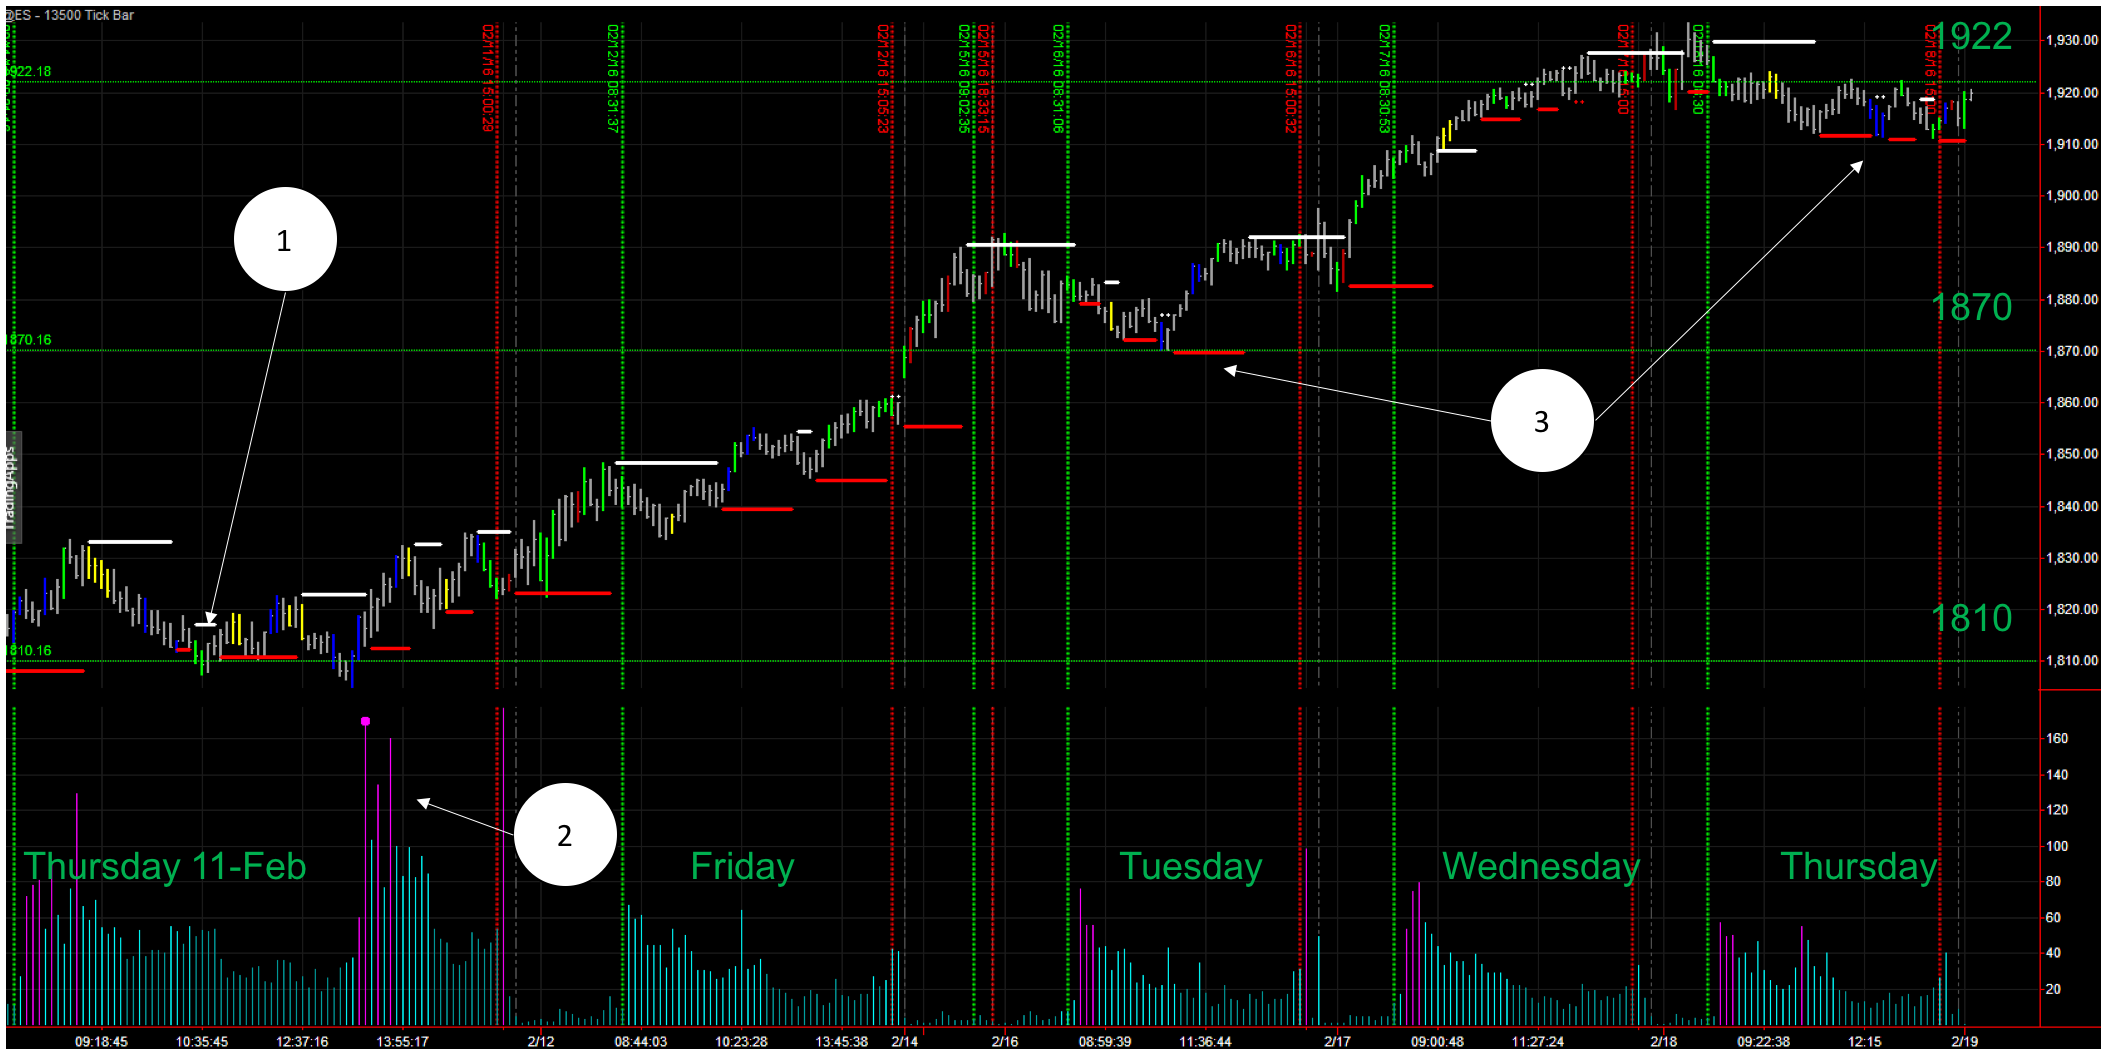
If you read the last weekly review post, we highlighted the volume and tape action that happened the last Thursday the 11th of February. (1) Green bars entered the market right at he bottom at 1810 level and shortly after high tape speed bars (2) were seen when this very same level of 1810 was tested. Since then the market has rallied up, crossing previous key support and resistance levels, like 1870. But is it the end of the rally or will it continue?
Predicting market future moves is a great pastime for many, but rarely reliable as the market conditions can change at any point of time. So my analysis here is valid until the next price bar, and that shall be the way you read all market predictions. Having said and understood this, what do we see in the market? So far little resistance on the way up. Now we could face some trouble to cross above 1920-1922 level, as it is a previous support/resistance level, but there is no volume or tape action that could give us a hint that the rally is over. Just the opposite.
(3) Every time that big volume (blue bars) enters the market, a rally follows. On Thursday the 18th of February we can see 3 support levels (red horizontal bars) together with high volume blue bars. This is for me the accumulation of volume that is entering the market to bust upwards. Until where? The next support/resistance level is 1940 and after that 1980.
Thought of the day: Is it me or the market tends to find support/resistance every 20 levels or so?

1 Comment