
XBP BB SR Levels:
1) A key support/resistance (S/R) level is clearly visible at 1844-45 level. Multiple resistance were printed during the trading session exactly at the same level. This is a strong indication of a key level and we will keep this 1844-45 in mind for the rest of the week.
1.1) Supports were printed on a slightly wider area of 1830-25
1.2) The action happened at this moment requires of a detailed analysis that you can find at the end of this post.

2) XBP VWAP: VWAP traders would have seen the main VWAP level to act as a resistance then support during the second half of the session. Coincidence or not with the volume S/R level identified by the BB SR Levels indicator.
3) XBP Market Key Levels: Open Range Low was the only remarkable level today with bouncy action the first time the market tried to cross it. You will see this type of action repeated over and over again. A key level often requires two attempts to be crossed.

4) XBP Tape Speed: Tape speed gave today very good signals to identify tops and bottoms. I want you to see that the first speed bar (at 08:54) marks a level (1838) which will remain a key resistance for the rest of the day. Draw a horizontal from that bar and you will see that it remains as a valid resistance level until the action that occurs at 14:20.
5) XBP Tape Players: Blue bars marked well tops and bottoms when paired with Tape Speed and BB SR Levels indicators. Special interesting behaviour occurred with the first green bar, at 08:42 and 1845 level. AS with the Tape Speed case, draw a horizontal line from this bar and you will see that 1845 remains a key resistance during the day. Note that his level matches the resistance levels printed by BB SR Levels indicator. Market action is clear with the XBP indicators 🙂
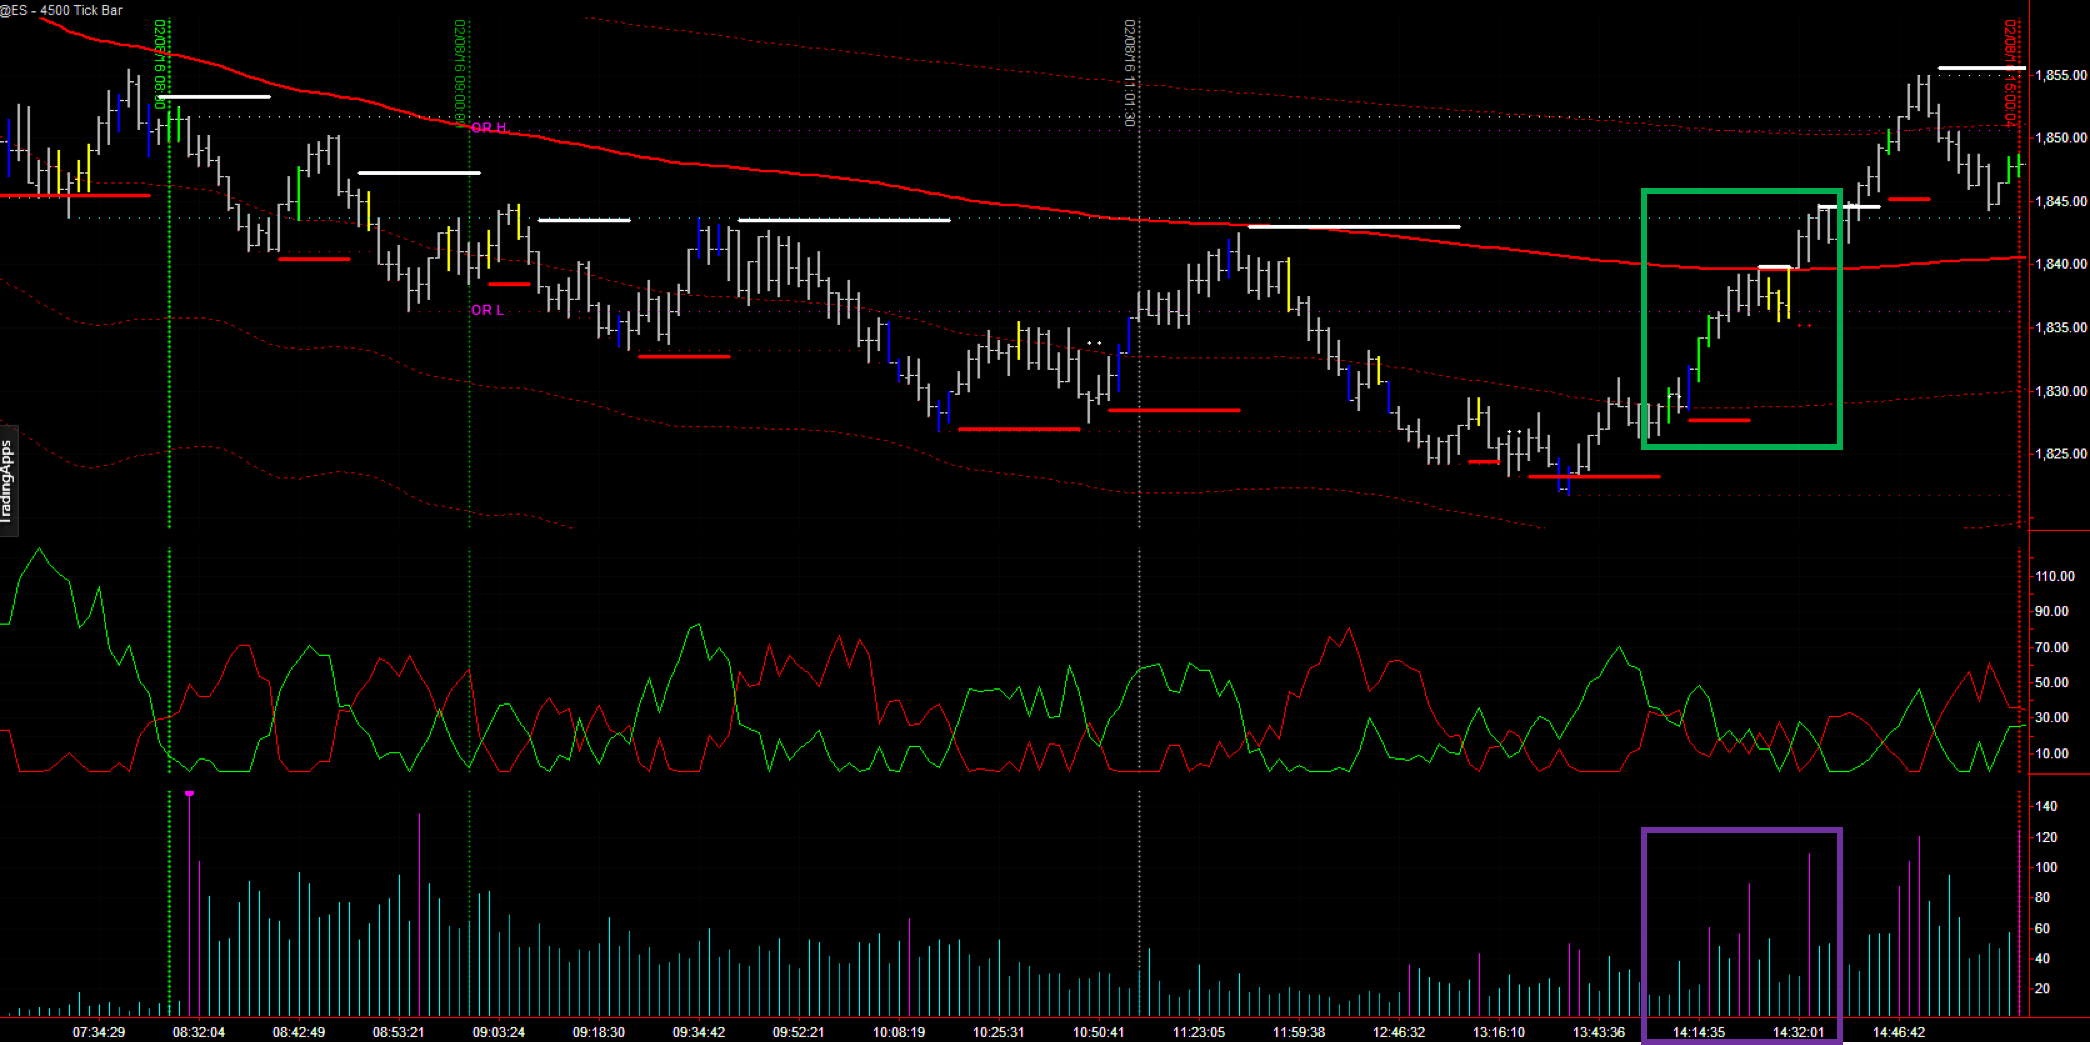
From 14:06 to 14:16 a set of green and blue bars appear, coupled with high tape speed bars and a support in BB SR Levels. The action happens at 1830 level which was the support level that hold the market during the day. We can interpret that the big market players entered the market here in a long direction sending the market higher and breaking the resistance of the day at 1845 level which hit the stops of many traders as seen in the high speed tape bar but lack of blue or green volume bars. I expect this level, 1830 to remain as a strong support/resistance level for the rest of the week.
Outlook for 9th of February 2016:
- Key Levels: 1845, 1830
- Direction bias: Long above 1830, Short below 1830 based on today’s analysis
