
1) XBP BB SR Levels: Trending days are never good days for oscillators. And our oscillator is not an exception. Highlighted areas 1.1 were wrongly ignored as valid supports. We are always working on perfecting our indicators, and we are looking into this. We hope the next version of this indicator to improve its accuracy on trending days. Yet, there is no perfect indicator, ever.
One good use of the BB SR indicators is to identify levels of support and resistance. In 1.2 the indicator correctly identifies one of these levels, 1925.

2) XBP VWAP: Main VWAP level acted as support, while +1 SD acted as a good trailing resistance.
3) XBP Key Market Levels: The Intraday High, at 1930, was a key resistance first and later support level for the second half of the day.
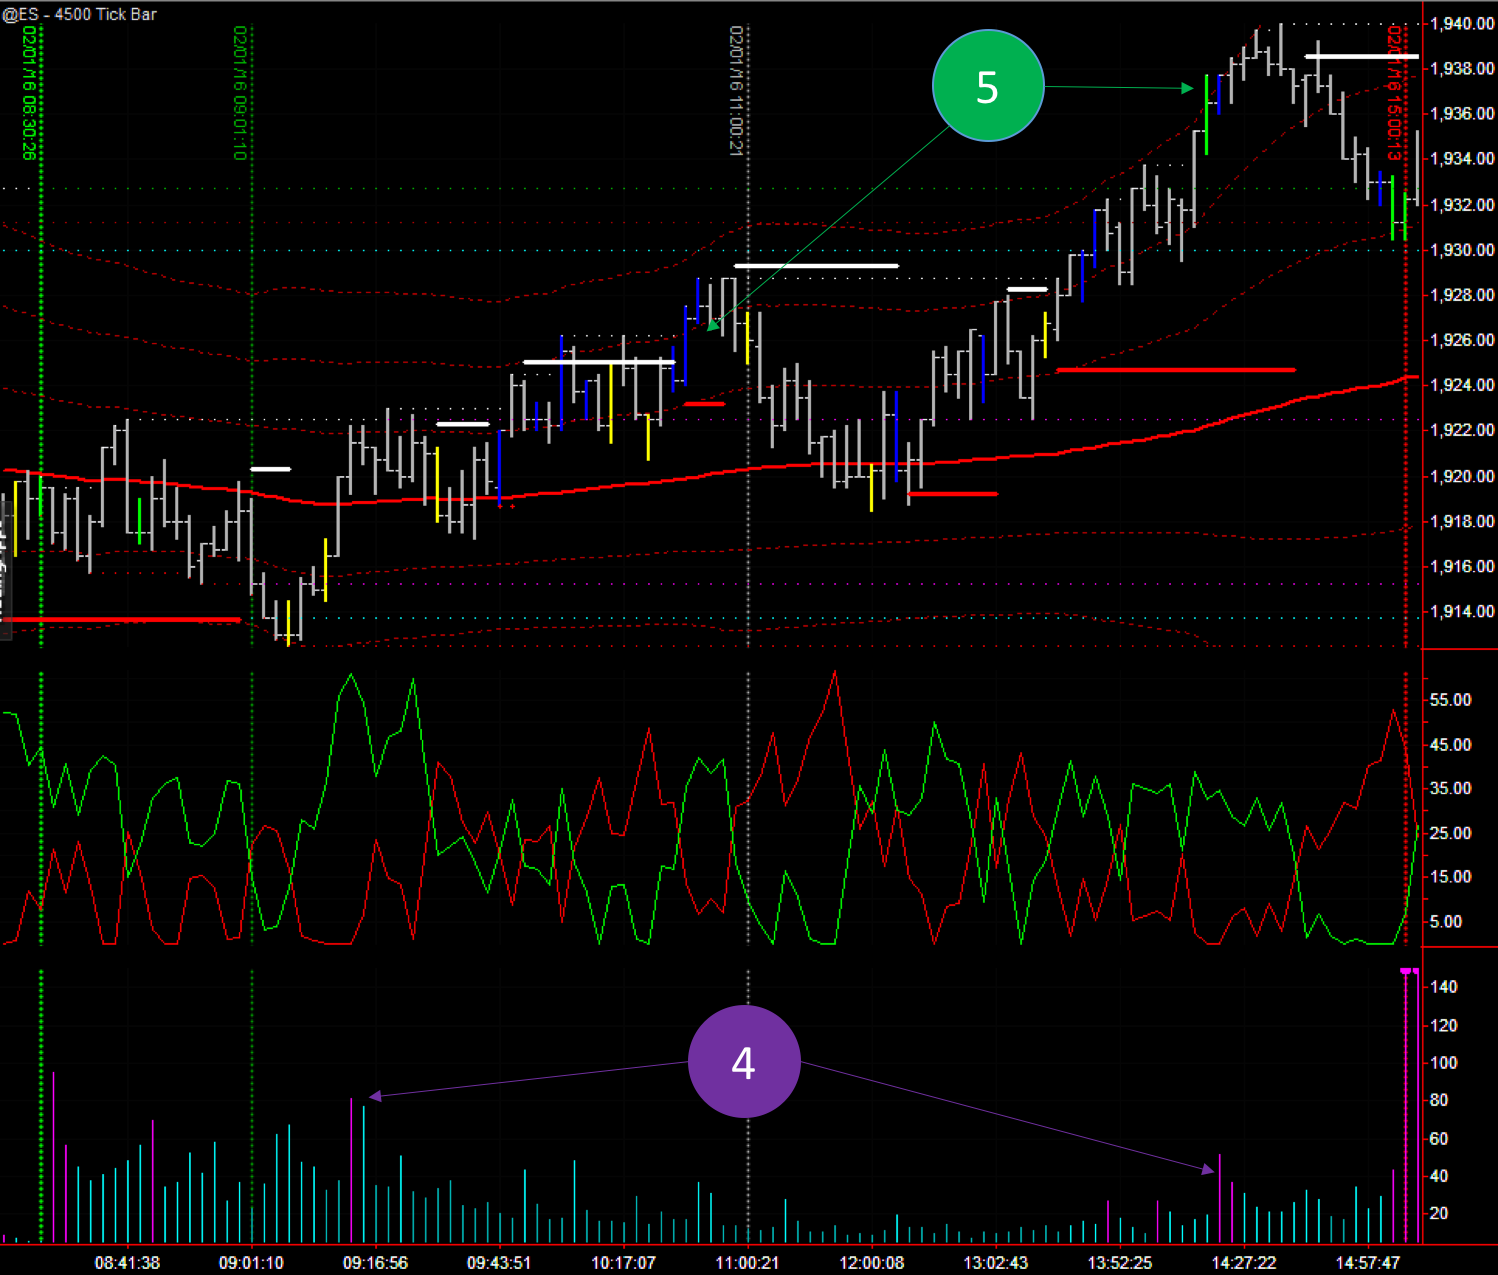
4) XBP Tape Speed: The first high speed signal came right on the bar that crosses above VWAP and start the rally for the day. Later, on the second highlighted bars, high tape speed marks the end of the rally together with a extreme high volume green bar in XBP Market Players.
5) XBP Market Players: Loads of volume at 1926 level. Difficult to read action and it can be confusing. When you see this type of action is better to just identify that level as a potential support or resistance based on the volume action now visible thanks to this indicator.
The second signal, the green bar at 14:19, signals perfectly the end of the rally, together with a couple of high speed bars in XBP Tape Speed. The combination of these two signals is a strong sign that the big volume just exited the market.
Hope your trading went well.
